6 Data collection
Connection to the curriculum: This is the sixth in a series of statistical articles for mathematics teachers. In this article, we discuss surveys for collecting data, referred to in Essential Mathematics Unit 3 Topic 4, Data Collection. In General Mathematics data collection is only considered in Unit 2, topic 1, Univariate data analysis and the statistical investigation cycle as a review of the statistical investigation cycle (ACGM026) implying that most students have learnt and understood the concepts in previous years.
Warm-up question: Which of these samples would be more accurate: (1) A sample of \(5\,000\) Queenslanders, or (2) a sample of \(2\,500\) Australians? Why?
6.1 Introduction
The scientific process answers research questions on the basis of evidence, which we call data. The means by which the data are obtained, however, is crucial.
As explained in Dunn and Marshman (2020), statistics are used to answer questions about a “Population” (a larger group of interest), on the basis of an imperfect sample. The details of this sample is crucial to understanding what is learnt about the target population.
6.2 Censuses and samples
A census is a rare situation when information is obtained from all (or practically all) of the individuals of interest, called the target population. The purpose of a census is to find the value of some quantity of interest, called a parameter (a number describing something about a population). Typical parameters may be a mean (e.g., the mean age of all Victorian teachers) or a proportion (e.g., the proportion of students who have attended both a private and public school).
Obtaining a census is rare because obtaining information from every individual is usually impossible or extremely costly. For example, the 2016 Australian census cost around $500 million (Martin, 2005; Lateral Economics, 2019): around half a billion dollars. A census is also costly in terms of time: collecting data from every individual in the target population can take a long time to collect, and hence a long time to analyse. This means that the results of the study will take a very long time to be released, and hence the need for the information may have passed or the circumstances have changed. The most recent Australian census was conducted on the 21st August 2021. Key population data will be released from June 2022, additional location variables and employment data will be released in late 2022 and the complex topics will be released in early to mid 2023 (Australian Bureau of Statistics (ABS), n.d. 2021 Census product release guide).
People received information on how to complete the form online between July and September and were encouraged to complete the form early if they knew where they were going to be. Some people were given paper forms and homeless people and those in remote areas had support from Census staff (ABS,n.d. 2021 Census overview). For more detail see the ABS Census page: https://www.abs.gov.au/census
Sometimes conducting a census is impossible. For example, to determine if aspirin works to relieve headaches, testing the population would require testing every person in the world… and even those not yet born (for whom we hope the medication will also work).
Even in situations where a census is possible, the census is seldom truly comprehensive. In Australia’s 2021 census, for example, some forms were unreturned (even though, in Australia, completing the census is compulsory; a fine of $220 per day is applied for not returning the census); some individuals in the population were very difficult to reach (for example, homeless people), and so on.
In the rare situations when a census is possible, the information is of excellent quality. However, in most situations very good (or sufficiently good) information can be obtained at substantially lower cost by using a sample.
6.3 Accuracy and precision
A sample is any subset of a population which is used to estimate a parameter. (A population refers to the entire set of individuals that are and might be of interest, such as all Year 11 students in South Australia, or all First Nations children in Australian schools.) The sample is used to compute a statistic: a number from a sample that estimates a parameter (Figure 1). For example, a sample could be used to estimate the mean age of all Victorian teachers, or to estimate the proportion of students who have attended both a private and public school.
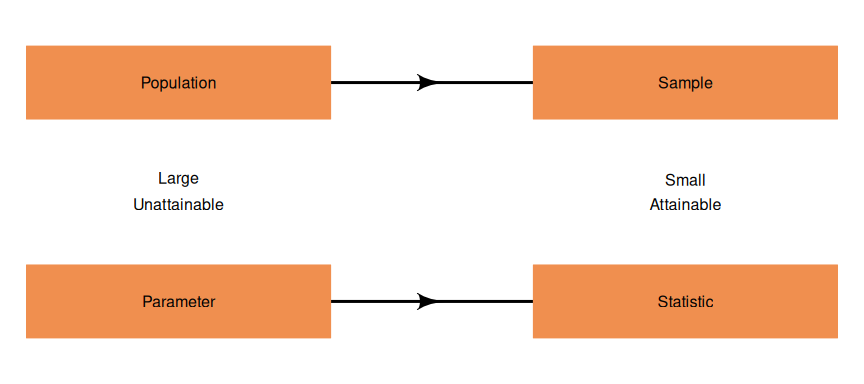
Figure 6.1: The relationship between a population (and its parameter) and the sample (and its statistic).
If a sample is to be used, further questions arise: How do we determine which subset of the population to use (and does it even matter)? How large should that subset be?
These two issues are related to the precision and accuracy (Figure 2) of statistics (i.e., sample estimates). Accuracy refers to sample estimates whose values are likely to be, on average over many possible samples, close to the value in the target population (i.e., the “correct” value). Precision means that all the possible sample estimates from all the possible samples are very close in value to the population value (that is, the estimate will not vary greatly from one sample to the next).
The size of the sample impacts the precision of the sample estimate: larger samples are more likely to produce sample estimates that vary less from sample to sample (but such estimates may or may not be close to the target population value). In contrast, the method of sampling impacts the accuracy: random (or probabilistic) samples are more likely to produce sample estimates that reflect the values in the population, on average. Clearly, the ideal estimate is both accurate and precise.
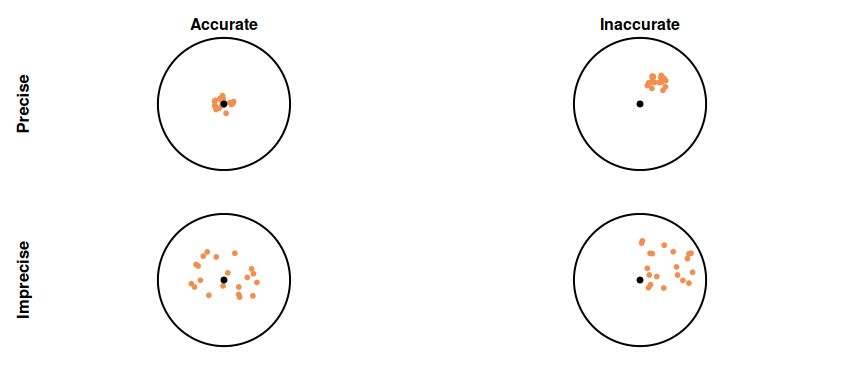
Figure 6.2: Accuracy and precision.
#> png
#>   2
#> Warning in par(oldpar): graphical parameter "cin" cannot be
#> set
#> Warning in par(oldpar): graphical parameter "cra" cannot be
#> set
#> Warning in par(oldpar): graphical parameter "csi" cannot be
#> set
#> Warning in par(oldpar): graphical parameter "cxy" cannot be
#> set
#> Warning in par(oldpar): graphical parameter "din" cannot be
#> set
#> Warning in par(oldpar): graphical parameter "page" cannot
#> be set
Obtaining a sample can happen in many ways, either good or bad. An ideal sample is one that is like a smaller version of the population. After all, the purpose of a sample is “estimating the value of a characteristic of the population as a whole” (ACARA Glossary: https://australiancurriculum.edu.au/f-10-curriculum/mathematics/glossary/?letter=S). In practice, this is possible by using a random (or probabilistic) sample.
6.4 Accuracy: Obtaining a sample
Obtaining a random sample is difficult, and often unachievable in practice. As used here, the word “random” is not the same as “haphazard” or “arbitrary” or “aimlessly”. “Random” means that the sample is chosen impersonally, without any human choices (conscious or unconscious) involved. The curriculum defines a random sample as:
A sample is called a random sample (or a simple random sample), if it is selected from a population at random. That is, all the elements of the population had an equal probability of being included in the sample.
(https://australiancurriculum.edu.au/f-10-curriculum/mathematics/glossary/?letter=R).
Even so, random samples can be found in different ways.
A simple random sample (SRS; Figure 3) means that every possible sample has the same chance of being selected. This is usually achieved by first creating a sampling frame (a list of all elements of the populations), and using random numbers to select which individuals in that sampling frame will constitute the sample. While this is possible in some circumstances (for example, schools probably can generate a sampling frame of all their students: a list of all students currently enrolled at the school), it is often not possible. For instance, if we wished to take a sample of dingos, using a SRS would be impossible because creating a sampling frame (a list of all dingos) is not possible.
Figure 3: A simple random sample (SRS). The grey dots represent the individuals in the populations, and the coloured squares represent those individuals chosen in the sample.
Other random sampling methods include stratified sampling (Figure 4; taking an SRS from each of a small number of large groups, such as a SRS of students at the senior school and another from the junior school); cluster sampling (Figure 5; taking an SRS of small groups and every individual in those chosen groups constitute the sample, such as selecting a SRS of classes at a school and using every student in each of those classes); systematic sampling (Figure 6; randomly select a starting point in, say, the sampling frame (such as the 10th student), and then select every 50th student thereafter); and a multistage sample (Figure 7; take a SRS from larger groups, then SRS from subsections, such as selecting a SRS of year levels, then a SRS of classes in those year levels, then a SRS of students in those classes).
Figure 4: A stratified sample: A SRS of two individuals are taken from every row. The grey dots represent the individuals in the populations, and the coloured squares represent those individuals chosen in the sample.
Figure 5: A cluster sample: A SRS of the columns is taken, and all individuals in those columns are taken. The grey dots represent the individuals in the populations, and the coloured squares represent those individuals chosen in the sample.
Figure 6: A systematic sample: Starting at the 11th individual (in the lowest row), then take every 24th individual. The grey dots represent the individuals in the populations, and the coloured squares represent those individuals chosen in the sample.
Figure 7: A multistage sample: Take a SRS of rows, and then a SRS of columns within those chosen rows. The grey dots represent the individuals in the populations, and the coloured squares represent those individuals chosen in the sample.
Using a non-random sampling method means that the sample may not represent the population of interest. That is, those individuals that are in the sample might somehow be different from those individuals that are not in the sample for the parameter under study. This is called sampling bias. For example, suppose we wished to estimate the proportion of Australian primary school students who have been to Rottnest Island (off the coast of Perth). Suppose our sample consisted of students living in Western Australia. These students would be far more likely to have visited Rottnest Island than those students not in the sample (i.e., living in other parts of Australia). An estimate from a sample of West Australian primary school children would overestimate the proportion, and even a very large sample would not improve the estimate, since the problem is one of accuracy (dependent on the type of sample) and not precision (dependent on the size of the sample).
Sampling bias means that the conclusion drawn from the sample may not represent the population. Non-random methods include voluntary response sampling (requesting volunteers to participate; those who volunteer may be more outgoing and extroverted, less busy, or more enthusiastic about the issue than those that do not volunteer); judgement sampling (where the researcher uses their judgement to take the sample; those chosen might be those the researcher does not feel intimidated by, or feels will respond favourably), or convenience sampling (individuals are chosen because they are convenient for the researcher; for example, a researcher might chose their friends and family, but these are likely to be very similar to each other).
6.5 Precision: samples sizes
The most accurate and precise sample is the entire population. In practice, a subset is needed. But how many? This is one of the most difficult questions professional statisticians need to answer.
The required sample size is always a compromise. On one hand, all other things being equal, a larger sample is preferred as it will give more precise results. But obtaining larger samples is expensive and time-consuming. In addition, taking sample sizes larger than necessary can be unethical: imposing upon individuals unnecessarily, for instance, is not ethical.
Whenever a sample is used rather than the entire population, sampling error is introduced. That is, the estimate from a sample (the statistic) is unlikely to give the exact value of the population value (the parameter). Consequently, the estimate of the statistic can only be reported as “give or take” a certain amount; for example, the mean age of all Victorian teachers might be estimated as 46, give-or-take about 4 years. This indicates that the observed sample mean of 46 could have come from a population with a mean likely (but not certain) to be between 42 and 50. This idea is formalised as a confidence interval (CI), to be discussed in a later article in this series.
Students will be familiar with the idea of sampling error. A coin has both a “head” and a “tails” side, but when a coin is tossed (say) ten times, “heads” does not always appear exactly 50% of the time; the percentage is subject to sampling error. Similarly with die, a “six” does not always appear one-sixth of the time in a set of rolls. Again, this is sampling error.
Whenever a sample is used to estimate a parameter, sampling error exists. In general, larger samples have smaller sampling error. However, gains in precision are harder to realise as sample sizes get larger (Figure 3). For example, increasing the sample size from 4 to 16 (only an extra 12 individuals in the sample) halves the width of the CI (a reduction in width of 50%). However, increasing the sample size from 16 to 50 (an extra 34 individuals) reduces the width of the CI by about 40%, and an increase from 50 to 100 (an extra 50 individuals) reduces the width of the CI by just 3% (the width is inversely related to the square root of the sample size). That is, only small gains are made by very large sample sizes, and a very small CI width requires extraordinarily large samples.
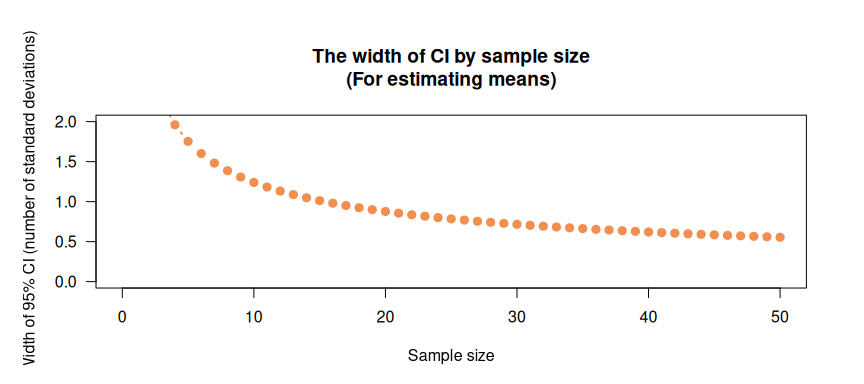
Figure 6.3: The width of the confidence interval (CI) by sample size.
6.6 Surveys
Once a sample of individuals has been obtained, many ways exist to obtain data from the individuals in the sample (laboratory experiments, or making observations, for example), and the appropriate method depends on the research question. One common way of obtaining information from people is to use a survey.
A survey is a series of questions that respondents complete. The questions may be closed (responses are restricted, such as when the respondent needs to select one answer from a given list) or open (where the respondent can respond in any way they wish).
Closed questions can have answer-options that may or may not be mutually exclusive. An example of a closed question with mutually-exclusive options might ask about a respondents Age, and give options such as “Under 20”, “20 to under 40”, and “40 or over”. An example of a closed question with options that are not mutually exclusive is “How do you watch movies on Netflix?” followed by a list of possible answers where respondents can select “all that apply”, such as “On my iPad or other tablet device”, “On my smart phone”, “On a television”, or “Other”. Respondents may or may not be given the chance to expand if they select the “Other” option. Providing too many options can be counter-productive.
An example of an open question is “What do you like about Netflix?” and leaving a space for respondents to give an answer.
The main advantage of a closed question is that the data are easier to analyse than data from open questions, and respondents can be directed to the types of answers the researcher wants. A disadvantage is that some respondents may only consider the options provided, and not even think of other answers even when the “Other” option is presented.
The wording of questions, especially closed questions, is very important, and is crucial to getting correct and fair information. Writing good survey questions is more difficult than it appears.
Survey questions need to be written so that they are not leading; that is, that they do not encourage respondents to answer in a particular way. An example of a leading question is “Do you think that our school should stop students using cling wrap, which does not biodegrade for hundreds of years?” A better question asks “Should our school allow or not allow students to use cling wrap?”
Survey questions need to be written so that they are unambiguous. An example of an ambiguous question is “Do you sleep more now?” The question has no reference: more now compared to when?
Survey questions need to be written so that they are only asking the informed. A poor question to ask school children might be: “Do you think the highest marginal tax rate is too high?” Students are unlikely to be knowledgeable enough to know how to answer this question (even if they know what the highest marginal tax rate is).
Survey questions need to be written so that they are not double-barrelled and ask too many questions at once. An example of a double-barrelled question is “Do you like food from McDonalds and Hungry Jacks?” A better approach would be to ask two questions: One about McDonalds, and another about Hungry Jacks.
Survey questions need to be written so that they do not ask about confidential matters. An example of a poor question is “Have you ever stolen money from your parents?” School students may not answer this question truthfully.
Survey questions need to be written so that they use simple, unambiguous and clear language.
A poor question is “Do you purchase fries when you order a drink unless you purchase a burger?”
It is unclear what an answer of “yes” means to this question.
In conclusion we need to ensure that we are careful with how we use the language of data collection. A survey is the series of questions that respondents are asked to complete. In contrast, the sample is the collection of people or objects that are responding to the survey questions. The sample is used to approximate the population that we are interested in finding out about.
Warm-up question answer: There is no way to answer this question until we know the question to be answered.
If the population of interest is ‘all Australians’, the second is likely to be the better option; if only Queenslanders are of interest, the first is likely to be the better option. But in either case, the type of sampling is not given. If neither sample is a random (or approximately random) sample, neither sample may be representative of the intended population, and the estimate may not be accurate.