2 The statistical investigation process
Connection to the curriculum: In this chapter, we discuss the statistical investigation process, referred to in General Mathematics (GM): * Unit 2, Topic 1 (Univariate data analysis and the statistical investigation process); * Unit 3, Topic 1 (Bivariate data analysis); ??? * Unit 4, Topic 1 (Time series analysis)).???
Warm-up question: A study aims to compare the mean reaction time of students while driving, when using a phone (\(P\)) and when not using a phone (\(N\)) (Agresti & Franklin 2007; Strayer and Johnston, 2001).
The researchers collect the data and find the mean reaction time for those driving when using a phone is \(585.19\) ms, and the mean reaction time for those driving when not using a phone is \(533.50\) ms.
Is there a difference in mean reaction time between the two groups?
2.1 Introduction
The statistical investigation process describes the whole process of conducting a statistical research study. The process given in the curriculum is one way to see the statistical investigation process (others exist, such as Wild and Pfannkuch (1999), shown at https://new.censusatschool.org.nz/resource/data-detective-poster/, but all are essentially similar). In the curriculum, the steps of the statistical investigation process are:
- identify a problem and pose a statistical question;
- collect or obtain data;
- analyse the data;
- interpret and communicate the results.
The statistical investigation process, then, gives a “big picture” of the process of research, and links together other seemingly disparate statistical topics present throughout the curriculum. Each mention of the statistical investigation process in the curricula also explicitly states that the process should be “implemented”.
We consider these steps one at a time; all these steps are covered in the curriculum, albeit in various places. Notice, however, that only Step 3 is computational; the rest are statistical. As explained in Dunn and Marshman (2020), statistics is not mathematics, but statistics uses mathematics when necessary.
2.2 Step 1: Identify a problem, and pose a statistical question
Problems lead to questions to be answered. Not all questions are research questions; not all research questions are questions that can be answered using evidence; not all research questions are statistical (or quantitative) research questions. The curriculum does not define a statistical research question, but generally a statistical research question is one that can be answered using numerical summaries of data (such as means or percentages).
Statistical research questions usually can be described using the PICO (or sometimes, POCI) acronym.
The P stands for the Population: the larger group we wish to learn about. (The word population here can refer to any group of interest: people, mushrooms, forests, webpages, etc.) Almost always in practice, we cannot study the whole population of interest, due to cost, time and/or practicality. For example, to determine if a new pain relief tablet works, we cannot study the entire population of the world; even so, we would also hope it works on people not even born yet. So, while the question is about a population, we need to study a subset of that population, called a sample. The challenge of statistics is trying to learn about a population when all we have is imperfect sample information (Fig. 2.1).
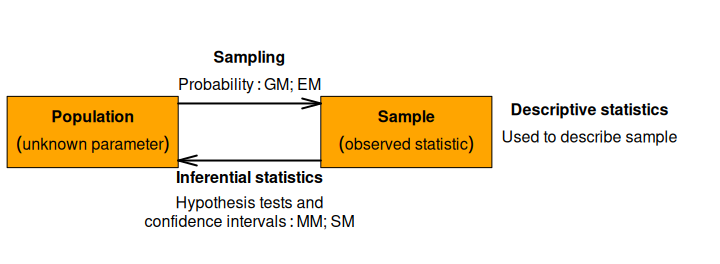
Figure 2.1: The relationship between the population and the sample, and where sampling, inference and probability contribute.
Figure 1: The relationship between the population and the sample, and where sampling, inference and probability contribute
The O stands for Outcome, which numerically describes something about the population (or sub-population) of interest, such as the mean heart rate, or the percentage of students owning an iPad.
The C, which is optional, stands for Comparison, which describes (for example) the two or more groups for which the outcome is compared. As examples: comparing the mean heart rate between students allocated to jump for two minutes, and those who sit still for two minutes; comparing the percentage of students owning an iPad between junior and senior secondary school students.
The I, which is optional, stands for Intervention. The intervention refers to situations where the groups being compared in the Comparison are determined by those conducting the study (rather than naturally occurring). Using the above examples, students can be allocated by the researchers to either jump or sit for two minutes (an intervention) but cannot be allocated to be in junior or senior school (no intervention).
To answer the research question (RQ), information is collected about or from the individuals in the sample. (The word individual here can refer to any member of the group: people, mushrooms, forests, web pages, etc.). The minimum information necessary is that needed to describe the Outcome (the heart rate of each individual student; whether or not each individual student owns an iPad), and the information needed to describe the Comparison (whether each student jumps or sits for two minutes; the year level of each student). Of course, other information can be, and usually is, also collected from the individuals too. Information collected from the individuals is called a variable; the actual values of the variables for the individuals is called data.
Here are three examples of statistical questions:
- RQ1. For secondary school students (P), is the mean cost of their last haircut (O) the same for males and females (C)?
- RQ2. For Year 11 and 12 students (P), is the mean number of apps on their phone (O) the same for males and females (C)?
- RQ3. For students studying IT (P), is the mean number of words typed per minute (O) the same when using a physical keyboard and a virtual keyboard (C)? For this RQ, an intervention could be used.
2.3 Step 2: Collecting or obtaining data
2.3.1 Know what to collect.
Once a question is posed, data are needed to answer the question. A well-posed RQ makes it easy to know what data are needed. For RQ1 above, the two variables required are “cost of last haircut” and “gender” for each student. Of course, other data can also be collected (such as the age of the student, or length of their hair), but do not have to be collected to answer the RQ. Formal analysis techniques incorporating these extra variables are beyond the school curricula, but informal techniques can be used (such as graphs).
2.3.2 Where to obtain data
Data may already exist and can be given to students (secondary data), or data can be collected by students themselves (primary data). In either case, using real (rather than made-up) data is important (Dunn, 2012): it demonstrates to students that what they are learning is practical and relevant, for example.
Using secondary data might appear to be simpler. However, finding suitable, accessible real data can be difficult. Ideally, data sets presented to students for use in schools should be:
- Readily understandable. Data that needs extensive explanation to be understood is distracting.
- Accessible: Data that is easily used and easily loaded into software means that students can focus on using the data to answer questions.
- Interesting: Data of interest to students is more likely to lead to student engagement.
(Note that the use of computers means that large data sets are not a barrier to their use.) Finding data sets meeting the above criteria can be time consuming. In the articles that follow, we will attempt to point to sources of interesting, real data.
Having students collecting their own data is engaging and usually fun for students and engages students in the investigation process rather than just computation. However, it may consume substantial class time. Furthermore, having students collect their own data may restrict studies to quite simple scenarios where data can be collected quickly, and where ethics approval is not needed. An alternative is to collect realistic data using a simulation tool, such as The Islands (Bulmer and Haladyn, 2011; use of The Islands is free but requires registration). The Islands accurately simulates many interesting scenarios that would not otherwise be possible (such as the effect of alcohol, blood tests and urine tests).
2.3.3 How to collect data
Designing how to collect data is probably the hardest part of any study. Issues include: the number of individuals to be sampled to obtain the required precision; how to select the individuals to fairly represent the population; and ensuring that all other variables or influences of importance have been suitably accounted for. Most of these issues are beyond the curriculum and cannot be discussed here.
2.4 Step 3: Analysing data
The analysis step is often what is considered “statistics”: the computation. This is often the step that mathematics teachers are most comfortable teaching and hence want to teach, but it is just one step of the process. In practice, the analysis is almost always deferred to computer software (or calculators). Before analysis, data usually needs to be cleaned: any errors found and suitably dealt with, and any variables described.
Analysis refers to exploring the sample data to see how it answers the RQ about the population. The type of analysis depends on what we want to do (that is, the type of RQ to be answered) and the type of data collected (the next chapter).
Informal analysis usually includes graphing the sample data (for example, in GM with the aid of appropriate graphical display …describe …and interpret this information in the context of the data ACMGM029 and in Essential Mathematics (EM) display numerical data as frequency distributions, dot plots, …ACMEM046) and summarising the sample data with numbers (e.g. in GM determine the mean and standard deviation of a data set and use these statistics …ACMGM030 and in EM calculate measures of central tendency, the arithmetic mean and the median ACMEM050): we can learn things (informally) from graphs and numerical summaries. Informal analyses are covered in GM and EM and will be discussed in a future article in this series.
Formal analysis refers to inference: making inferences about populations based on the imperfect sample. Formal analysis includes confidence intervals (assessing the precision of sample estimates) and hypothesis testing (making decisions about the population from the sample). Many types of inference are possible (Kanji, 2006), and understandably the school curriculum refers to only a small number of inferential procedures. Formal analyses are covered in Mathematical Methods (MM) and Specialist Mathematics (SM) and will be discussed in a future article in this series.
The three key observations are that
- RQs are about a population (numerically described by an unknown parameter, such as a population mean), but we only study a sample (numerically described by a known statistic, such as a sample mean);
- the value of the sample statistic is likely to be different in every sample; and
- we often only study one of the many possible samples.
If students are answering the RQ in class and collecting their own data, sharing the sample statistics from each group may be possible so that students can see that different samples produce different statistics.
Inference essentially answers this question: is any relationship observed in the sample because a relationship really exists in the population, or is the observed relationship just an artefact of the particular, single sample we happen to have selected?
2.5 Step 4: Interpreting and communication results
The statistical investigation process begins with asking a RQ and should conclude by answering the RQ. However, the question is about a population, but we only study a sample, which means we cannot give a definitive answer to the RQ. Using the descriptive statistics in GM and EM, we can present informal numerical evidence for comparing samples, and discuss the differences. Using formal inference procedures (confidence intervals and hypothesis tests, as discussed in MM and SM) allow us to give more formal and nuanced answers to the research question.
2.6 Implementation
The GM curriculum suggests implementing the whole statistical investigation process. One way is through student-led projects. These can be challenging, as things sometimes go wrong, and answers are not known in advance; indeed, there may be no single answer.
A practical statistical question requires the student to identify a sensible and accessible Population; a sensible, measurable Outcome; and two (or more) groups to compare; and to decide if an intervention is to be used. In schools, a teacher must ensure that the RQ, and hence the data, can be appropriately analysed by the tools that students will learn, in the time that is available.
Unfortunately, only GM refers specifically to the statistical investigation cycle. EM, for example, refers to surveys, survey procedures, sources of bias, and bivariate scatterplots but does not link all the content descriptors through a statistical investigation; these could be taught through the statistical investigation cycle. MM includes both sample proportions and confidence intervals for proportions and SM includes sample means and confidence intervals for means, but neither of them include a reason for these calculations or refer to a RQ as motivation. We strongly encourage teachers to use RQs. With the time constraints of MM and SM, using existing data may be more appropriate. Some suggestions are:
- data from Australian Bureau of Statistics website (e.g. using data from the local region) (https://www.abs.gov.au/),
- Census@school, or
- the Bureau of Meteorology (http://www.bom.gov.au/).
As an extension, teachers may also consider having their students present a poster or presentations of their study. Posters may even be entered in the National Schools Poster Competition (https://www.ssaipostercomp.info/schools/; an entry fee applies) and a chance to win prizes (even international prizes).
Warm-up question answer: We don’t know if there is a difference between the groups… in the population.
A difference clearly exists between the sample means. Even young children can see that; we do not need statistics to tell us that the two sampe means are different.
But research questions are about populations. The sample means are different, but there are two possible reasons:
- The two population means may be equal, and the sample means differ only because of the people who ended up in our particular sample.
- The population means really may be different, and this is why the sample means are different.
How do we know which of these explanation is supported by the data? That is part of the process of inference, specifically hypothesis testing.