1 Statistics and its relationship to mathematics
Connection to the curriculum:
???
Warm-up question:
What is the mean of these data values?
\(\qquad 335\), \(12\), \(18\), \(340\), \(15\).
The answer is at the end of this chapter
1.1 Statistics is not mathematics
Statistics is a discipline in its own right, separate from mathematics:
Just as physics attempts to understand the physical universe and presses mathematics into service wherever it can help, so too statistics attempts to turn data into real-world insights and presses mathematics into service wherever it can help.
(Wild, Utts & Horton, 2018)
Implicit in this statement is that statistics is embedded in a real context:
While mathematics promotes abstraction, statistics insists on interpretation in context.
(Gattuso & Ottaviana, 2011 p. 126, emphasis added)
That is, statistics is not computation; statistics is about what the computations mean and why they are necessary. For example, Pfannkuch (2008) highlights this distinction when she observes that schools often emphasise the making of graphs, rather than interpretation of what these graphs mean.
While mathematics can treat (for example) differentiation separated from context, doing so in statistics does students, and statistics, a grave disservice. For example, to provide an example of differentiation, a teacher can make up a function to differentiate (say, \(y = (x − 4)^2\)), but statistics needs a context:
Mathematics and statistics are different in the way that they use numbers. Mathematics mostly deals with numbers, their operations, generalisations and “abstractions”, while for statistics numbers are “data linked to a context”, which is essential to statistical reasoning as well as to mathematical modelling.
(Gattuso & Ottaviani, 2011, p. 126)
Cobb & Moore (1997) ask provocatively: “If you purge statistics of its mathematics content, what intellectual substance remains?” (p. 801). The answer is that plenty of intellectual substance remains (as shown in our next article about the statistical investigation process).
1.2 Mathematical language and statistical language sometimes conflict
Some language and symbols have different, and even conflicting, meanings in statistics and mathematics (Dunn, Carey, Richardson, & McDonald, 2016). Examples include words such as “estimate”, “graph”, “significant”, “variable” and “linear”; symbols include \(\pi\) and \(\pm\). For example, the equation \(y = 2 + x + 3\log x\) is not a linear function in mathematics, but it is called a linear function in statistics (the functions \(x\) and \(\log x\) are combined linearly). As a second example, in mathematics the expression \(3 \pm 1\) (say, as the result of solving a quadratic equation) means “either \(2\) or \(4\)”, where as the same expression in statistics (say, in a confidence interval) means “any number between \(2\) and \(4\)”.
1.3 Statistical thinking is not mathematical thinking.
Thinking statistically is different than thinking mathematically. However, most mathematics teachers have been taught and have considerable skills in thinking mathematically only. The Guidelines for Assessment and Instruction in Statistics Education (GAISE) College Report describes statistical thinking as:
…understanding the need for data, the importance of data production, the omnipresence of variability, and the quantification and explanation of variability
(Aliaga et al., 2010, p. 14).
Many definitions point to the presence of variability (uncertainty) as but one way to distinguish mathematical and statistical thinking:
Statistical thinking, in large part, must deal with this omnipresence of variability; statistical problem solving and decision making depend on understanding, explaining, and quantifying the variability in the data. It is this focus on variability in data that sets apart statistics from mathematics.
(Franklin et al., 2007, p. 6)
For example (adapted from the GAISE Pre-K—12 Report (Franklin et al., 2007)), assume a coin is fair. A mathematical question is to ask: “If we toss the coin five times, how likely is it that we would toss 0, 1, 2, 3, 4 or 5 heads?” A statistical question is to ask: “Is this a fair coin?”
1.4 So what is statistics?
Definitions vary, but the definition of “statistics” given by the American Statistical Society is typical:
…the science of learning from data, and of measuring, controlling and communicating uncertainty (e.g.: https://www.amstat.org/ASA/Newsroom.aspx).
Chatfield (2018, p. 15) describes statistics as
the science of making decisions in the face of uncertainty.
The notion of variation (uncertainty) abounds in definitions of statistics. Uncertainty and variation is everywhere, and statistics provides tools for making decisions where variation exists.
Variability (uncertainty) arises because, in part, statistics generally seeks to answers questions about populations (i.e. very large groups, such as “All Australians” or “All wombats”) only based on information from a subset of that population (which we call a sample). Since every sample we obtain from the population is likely to be different (that is, contains different Australians, or different wombats), the data we obtain in each sample is likely to be different, and so the conclusions we make could possibly be different for each sample too. Since we almost always only have a single sample, we cannot be certain about what we learn from the sample about the population.
Two broad roles exist for statistics: descriptive and inferential statistics. Descriptive statistics concerns the describing of data, usually sample data. This includes producing graphs, and numerical descriptions of data (such as means and standard deviations). Descriptive statistics is covered in EM and GM. Inferential statistics concerns learning about the larger population from the sample. Doing so requires some knowledge of probability. Inferential statistics and probability are covered in MM and SM.
1.5 Why teach statistics?
Famously misquoting H. G. Wells, American Statistical Society president Samuel Wilks once said:
…statistical thinking will one day be as necessary for efficient citizenship as the ability to read and write
(Wilks, 1951, p. 5).
Many scholars believe that “one day” is now:
Our lives are governed by numbers. Every high-school graduate should be able to use sound statistical reasoning to intelligently cope with the requirements of citizenship, employment, and family and to be prepared for a healthy, happy, and productive life […] A major objective of statistics education is to help students develop statistical thinking.
(Franklin et al., 2007, p. 1, 6)
ACARA suggests the same without actually naming statistics; one aim of the Australian Curriculum: Mathematics is to:
… ensure that students are confident, creative users and communicators of mathematics, able to investigate, represent and interpret situations in their personal and work lives and as active citizens.
(Australian Curriculum, Assessment and Reporting Authority, n.d.b, p. 1)
Furthermore, Chick and Pierce (2013) conclude that teachers themselves need to be statistically literate for their own benefit, to interpret and use NAPLAN (and similar) reports.
1.6 Teaching statistics is different than teaching mathematics
Since mathematics and statistics are different, teaching mathematics and teaching statistics are different too: “Statistics should be taught as statistics” (Cobb & Moore, 1997, p. 814). One challenge is that mathematics teachers are usually most comfortable with, and prefer, formal mathematics and computation. Nonetheless:
…data collection, design, exploration of data, and the interpretation of results should be emphasized in statistics education for statistical literacy. These are heavily dependent on context, and at the introductory level, involve limited formal mathematics
(Franklin et al., 2007, p. 9).
Furthermore:
To teach statistics well […] one must, like a teacher of literature, have a ready supply of real illustrations, and know how to use them to involve students in the development of their critical judgment […] In statistics, however, improvised examples don’t work, because they don’t provide authentic interplay between pattern and context.
(Cobb & Moore, 1997, p. 803).
Many mathematics students (and teachers) expect problems to have one correct answer, forcing an emphasis on correct computation, application of formulas, or production of graphs (Gattuso & Ottaviana, 2011). In contrast, statistical thinking emphasises the meaning of computation and graphs, such as understanding the data (average, distribution, variation) and what this tells us.
1.7 Mathematics teachers are well-placed to teach statistics
Although identifying many differences between mathematics and statistics, and the teaching of mathematics and statistics, mathematics is still important in statistics (Gattuso & Ottaviana, 2011; Franklin et al., 2007):
…all statistics courses require some preparation in mathematics, and some require a great deal
(Cobb & Moore, 1997, p. 803)
For this reason, mathematics teachers are well-placed to teach statistics. But teaching statistics successfully needs teachers to understand the differences between mathematics and statistics.
1.8 Statisticians often don’t use computation
In practice, modern statisticians rarely ever perform computations, but delegate computations to software, so they can focus on the truly statistical components (context and meaning). Indeed, many statisticians only engage explicitly in mathematics through basic computation and mathematical logic. But the temptation for many mathematics teachers (and evident in many mathematics textbooks) is to teach statistics as a computation-based topic, focussing on formulae, rather than teaching the statistical elements.
1.9 Statistics can be rewarding to teach
Although mathematics teachers may see challenges in teaching statistics, teaching statistics can be rewarding. Because statistics has a real-world context, teaching statistics offers mathematics teachers great opportunities for “connecting classroom learning to the real world” (Dunn & Marshman, 2019).
These connections can make mathematics classes relevant (students can see real questions being answered; Gough, 1998; Dunn & Marshman), fun (students may be able to collect their own data, from activities (Smith, 1998) or realistic simulations of more challenging situations (Huynh, et al., 2016)), and interesting. In some situations, different students may come up with different, sensible answers (Dunn & Marshman, ???), promoting pedagogically-useful discussions. This task of connecting with the real-world is important in all teaching, but especially in mathematics (Gainsburg, 2008; Smith & Morgan, 2016).
However, finding appropriate data sets (and activities) can be difficult. (ADD REFS FROM RiMEA) Ideally, data sets should be interesting and real (Hand et al., 1996) but simple enough to understand with a simple context. Such data sets exist (in books such as Hand et al. (1996) and on web sites such as Smyth (2011)), but can be time consuming for teachers to find. In this series, we will provide links to some interesting data sets, or data collection ideas, that may be of use to teachers.
1.10 Conclusion
Statistics is not mathematics, and teaching statistics is not the same as teaching mathematics. Nonetheless, teaching statistics in mathematics classes can be rewarding. In subsequent chapters, we will explain statistical terms and concepts that are perhaps unfamiliar to mathematics teachers, and provide some resources that may be of use in teaching.
Warm-up question answer: Context is crucial! The data are angles, so that \(359^\circ\) is almost the same as \(1^\circ\); the dots in Figure 1.1 show these observations.
An alternative approach is to use the number of degrees either side of \(0^\circ\), and hence the values could be seen as \(335 - 360 = -25\); \(12\); \(18\); \(340 - 360 = -20\); and \(15\). That is, the values are: \(25\); \(12\); \(18\); \(-20\); \(15\). Then, the mean is \(0^\circ\). This is a far more sensible value for the mean (Figure 1.1).
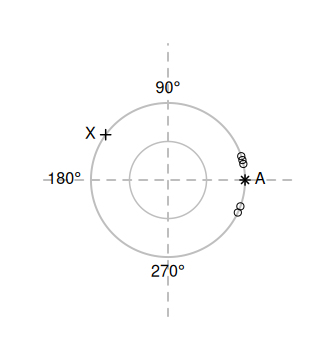
Figure 1.1: The directions for the angles in the warm up problem. The observations are shown with empty circles. Point \(A\) (and the star) is the correct mean; Point \(X\) (and the cross) is the incorrect mean.