3.2 Creating boxplots
For this section, the data introduced in Sect. 5.1 are used.
- Use the jamovi menu: select Plot.
- Add the variables. Place the quantitative variable in the Variables area, and the qualitative variable in the Grouping variable 1 area.
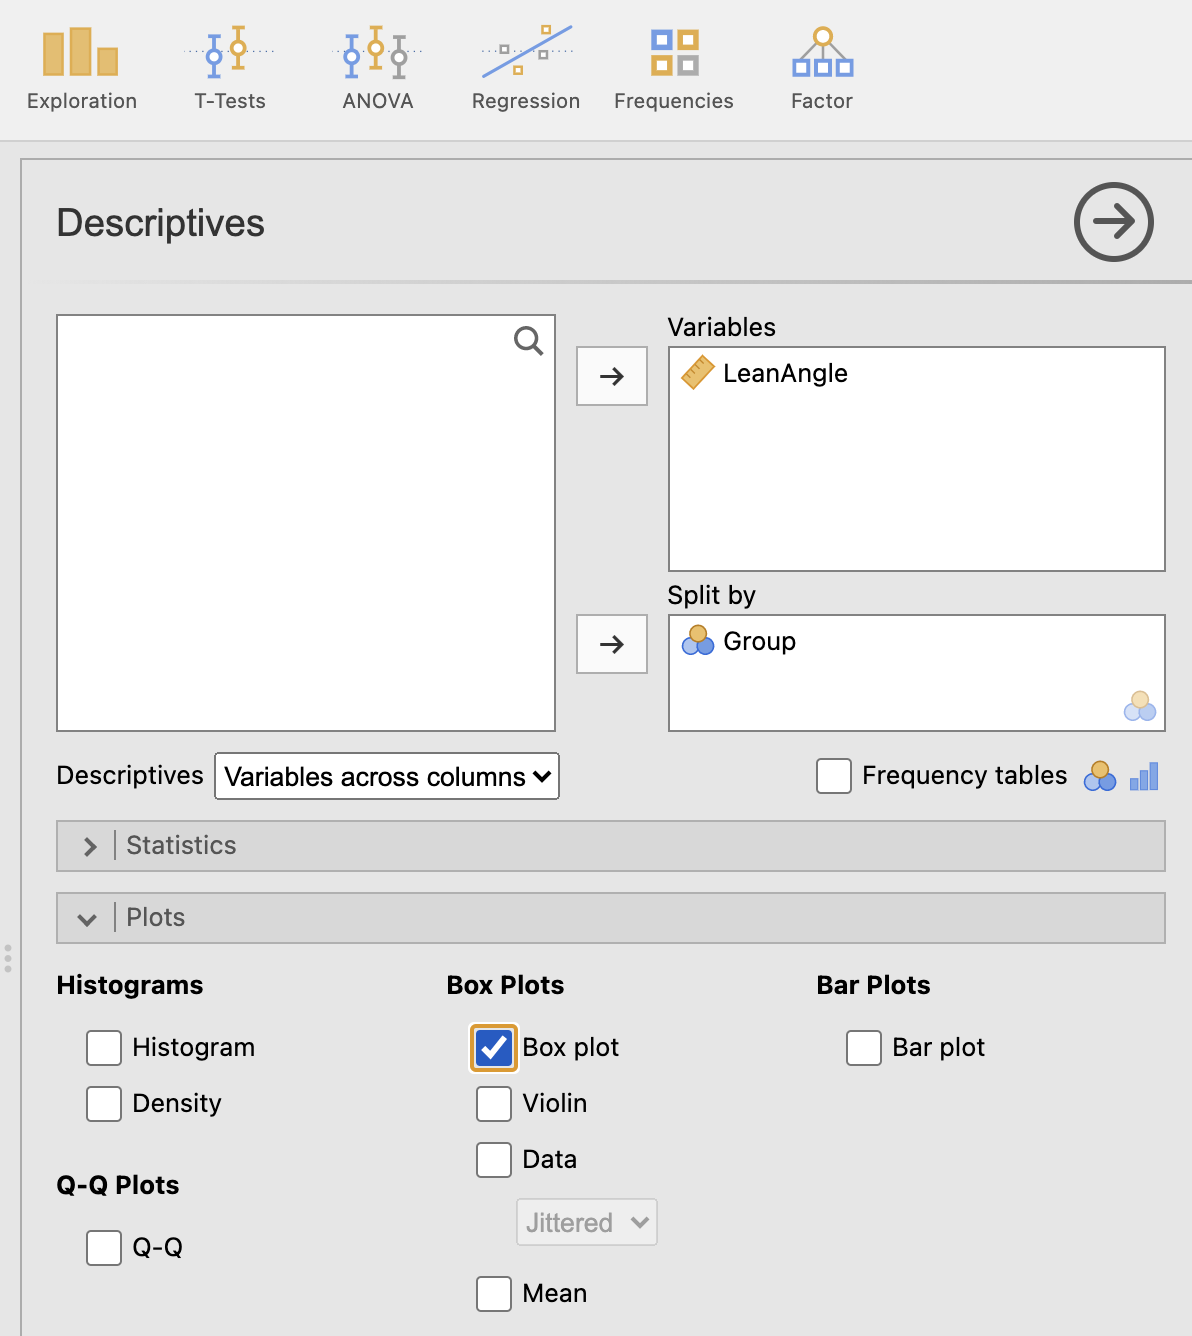
FIGURE 3.1: Selecting the variables for a boxplot.
Your graph will appear in the jamovi Output window.
To edit this plot, see Sect. 3.5.