6.2 Analysis
This data set is available in Appendix 11. Once the data are entered or loaded, we can begin analysis:
- Use the jamovi menu: select Analyses> T-Tests> Independent Samples T-Test (Fig. 6.1).
- Select the Variables.
- For the Dependent Variables, add the quantitative variable (here,
LeanAngle). - For the Grouping Variable, add the qualitative variable (here,
Group).
- For the Dependent Variables, add the quantitative variable (here,
- Then select the options:
Student'sandWelch'sshould be select to perform the hypothesis test and compute the CIs.Mean differenceto show the difference between the two means in the output.Confidence intervalto show the CI for the difference between the two means.Descriptivesto show the numerical summary of each group.Descriptives plotto show the error bar chart.
Even if you have a one-tailed hypothesis, keep the hypotheses as the two-tailed (first) option, or you will get some strange output.
The one-tailed \(P\)-value will be half the two-tailed \(P\)-value.
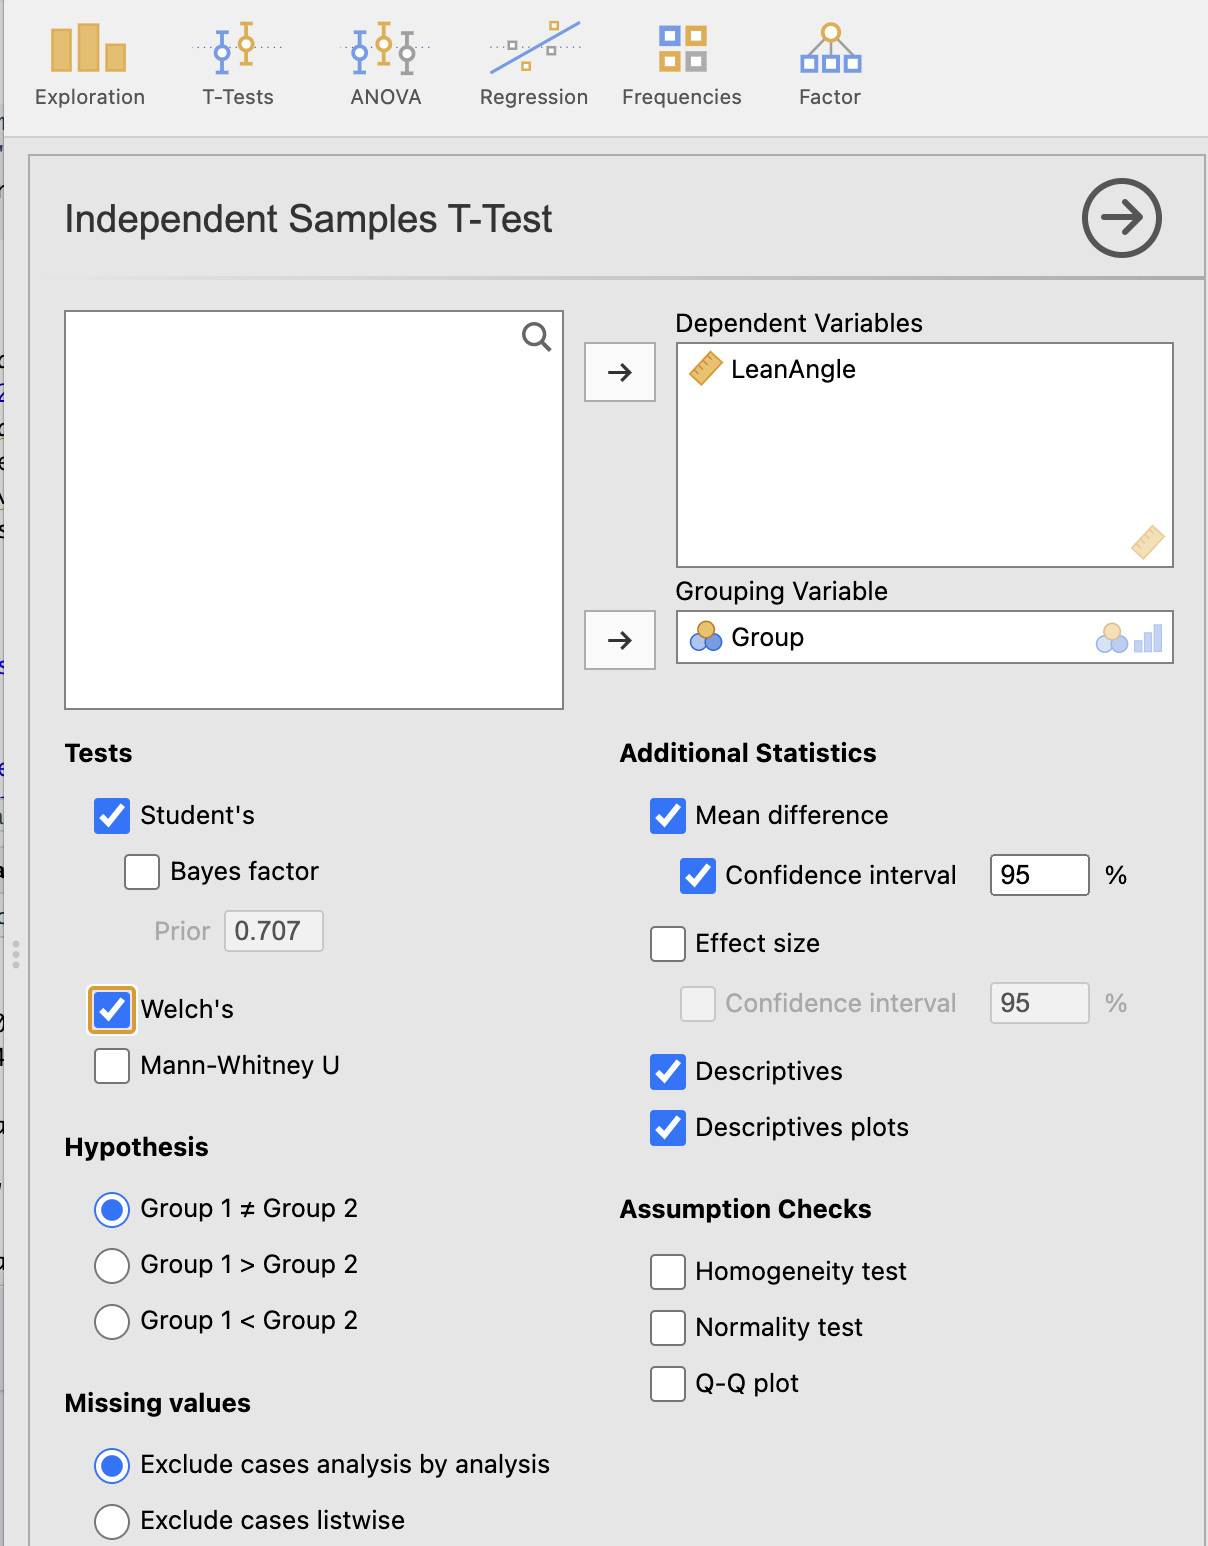
FIGURE 6.1: Enter the variables.
- You will have your output in the jamovi Output window.