2.1 About jamovi
- jamovi is a relatively new package (built on R (R Core Team 2025), which is very solid and reliable, and has been available since 1993).
- jamovi is free to download, from the jamovi webpage; avoid the Cloud version.
- Except for graphs, jamovi output should not be presented in reports or presentations. Instead, the information from jamovi output should be used to construct proper tables (e.g., rounded numbers; units of measurement; decimal points aligned; etc.).
- The number of displayed decimal places (
dp) or significant figures(sf) can be adjusted using the three vertical dots in the top right corner.
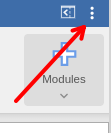

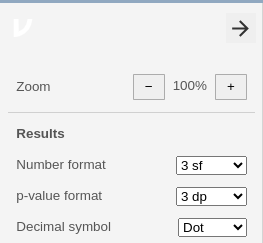
FIGURE 2.1: Left: Click on the three dots to set the number of decimal places or significant figures shown. Right: The default settings
References
R Core Team. 2025. R: A Language and Environment for Statistical Computing. R Foundation for Statistical Computing. https://www.R-project.org/.