5.2 Analysis
This data set is available in Appendix 11. Once the data are entered or loaded, we can begin analysis:
- Use the menu: select Analyses> Frequencies> Independent samples (\(\chi^2\) test of association) (Fig. 5.1).
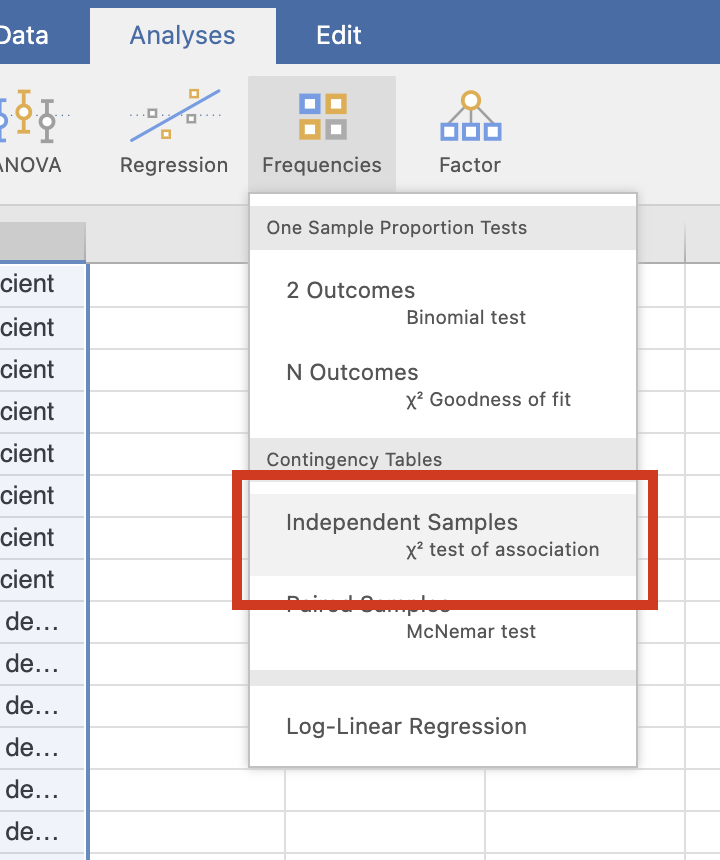
FIGURE 5.1: Select the correct test.
- Select the variables: dragging them from the left panel to the Rows and Columns areas as appropriate (Fig. 5.2). In Table 1.1, Diet is in the rows of the table, for example.
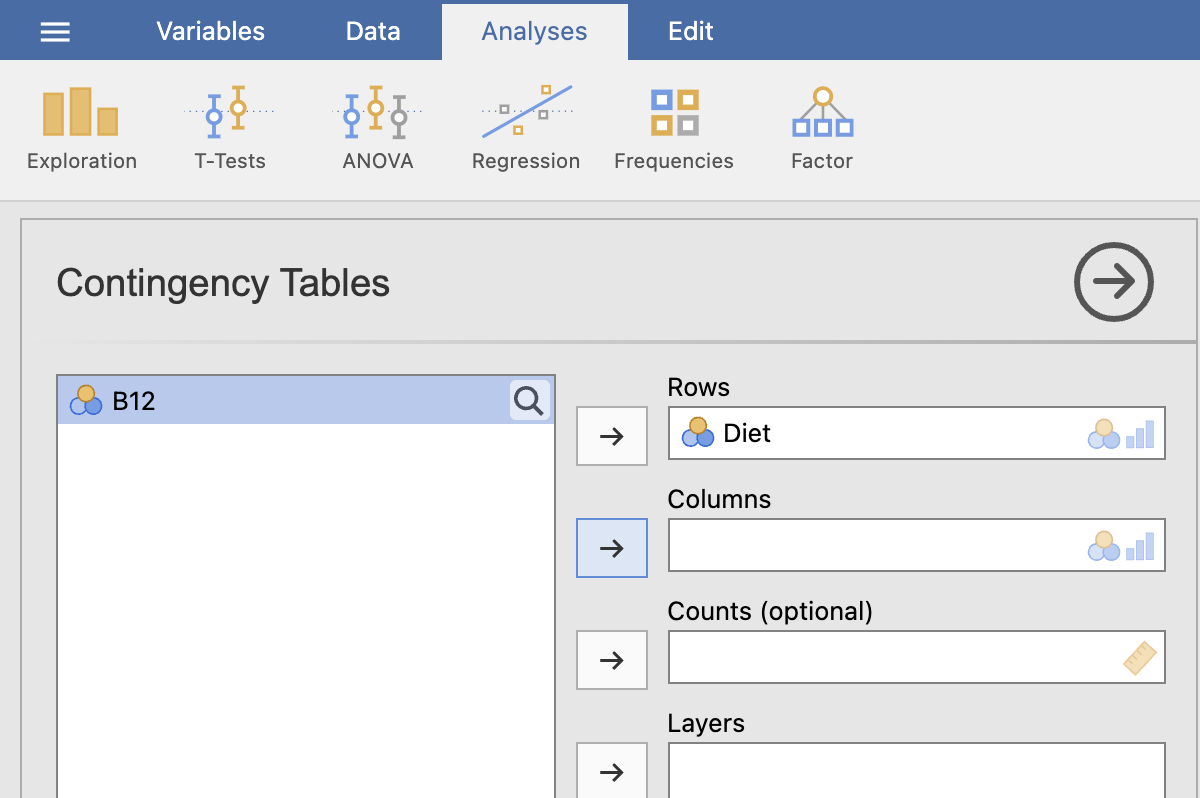
FIGURE 5.2: Enter the variables.
Select the analysis options: Under the area where you entered the variables, select the right-pointing arrow beside Statistics, and then (Fig. 5.3):
- Select
X2: this conducts the \(\chi^2\) hypothesis test for comparing odds. - Select
z test for difference in 2 proportions: this conducts the \(z\)-test to compare proportions. - Select
Odds ratio: this shows the value of the odds ratio. - Select
Difference in proportions: this shows the difference between the two proportions. - Select
Confidence intervals: this shows a CI for the odds ratio, and a CI for the difference between the proportions.
- Select
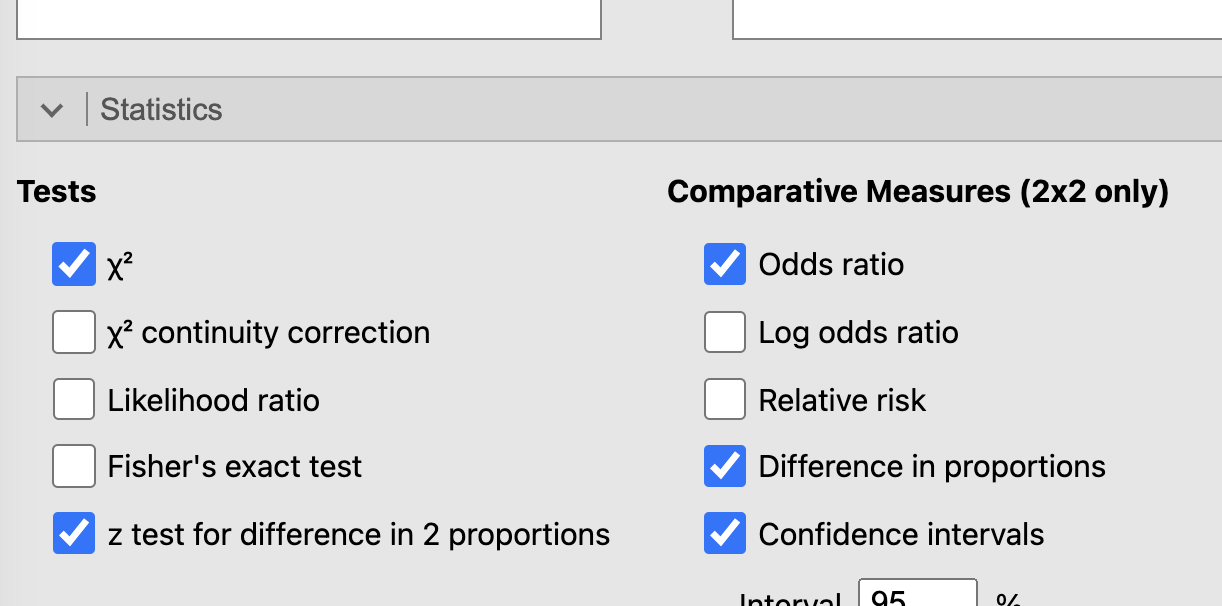
FIGURE 5.3: Check the correct options.
- You will have your output in the jamovi Output window on the right.