10.3 Boxplots
For this section, the data introduced in Sect. 9.1 are used.
- Use the SPSS menu: select Graphs> Chart Builder…
- Select the type of plot. Select Boxplot, then select the first template from the top row, and drag it to the canvas (Fig. 10.8).
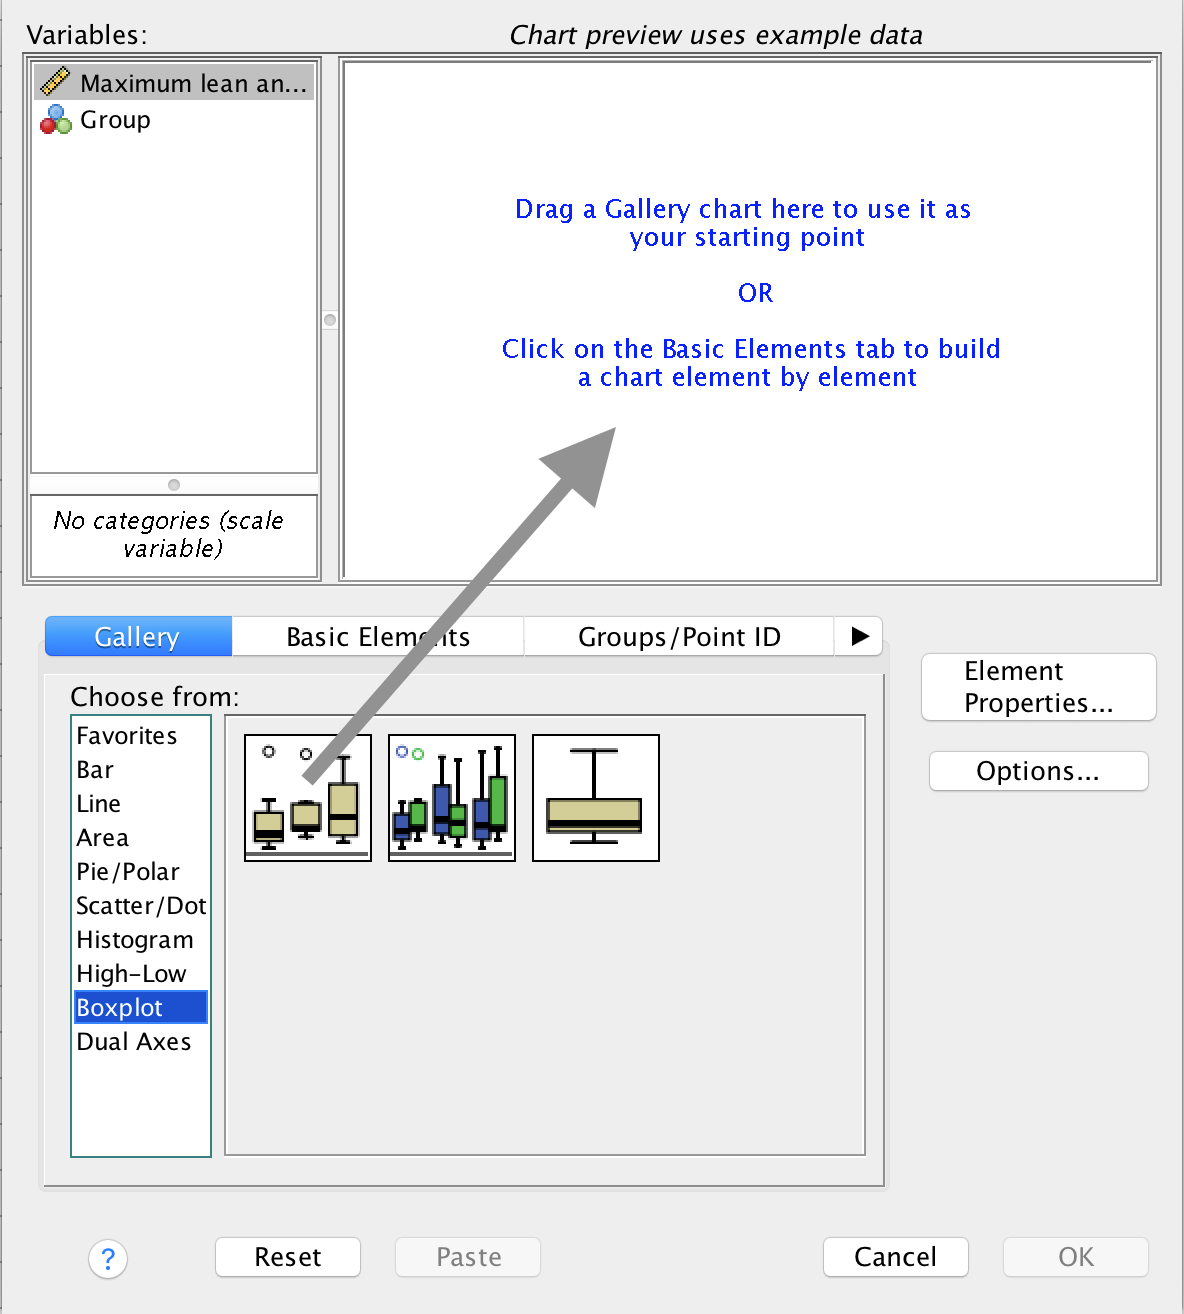
FIGURE 10.8: Selecting a boxplot.
- Add the variables. Drag the qualitative variable to the bottom (left-to-right) axis; drag the quantitative variable to the vertical (up-and-down) axis (Fig. 10.9).
- Press OK. You will have your graph in the SPSS Output window.
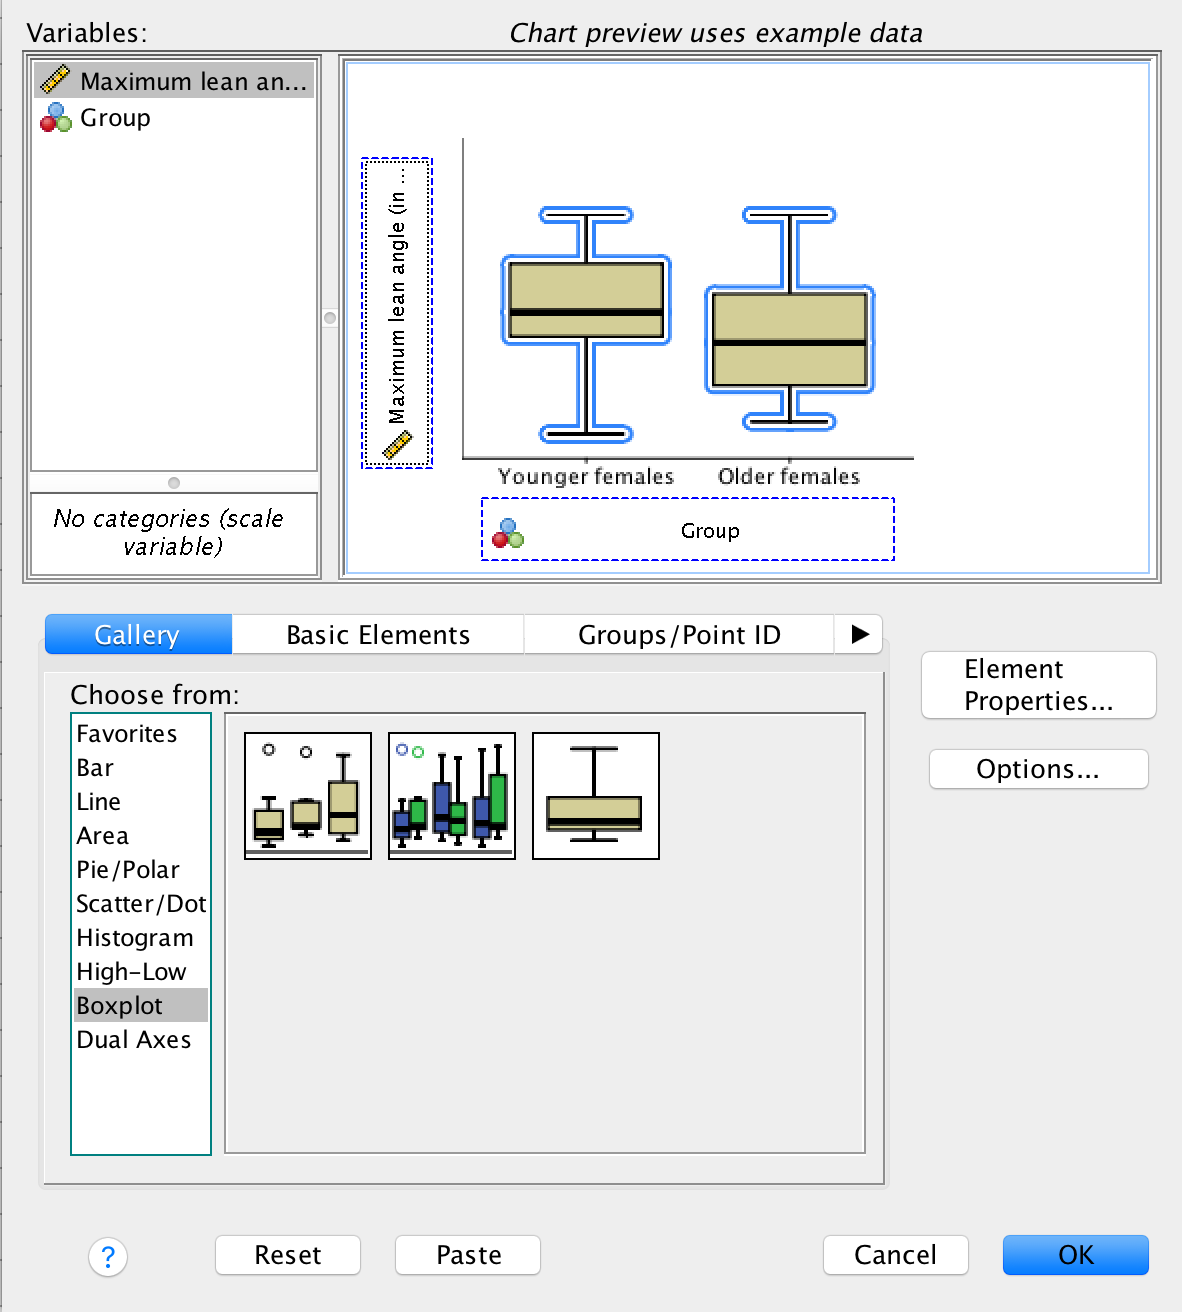
FIGURE 10.9: Adding the variables to create a boxplot.