5.3 Critiquing students' numerical summaries
In this activity, you get to critique actual student Project submissions, so you can critique your own before submission.
Critique the numerical summary in Fig. 5.3, a screenshot from a student Project Report. Identify ways to improve the numerical summary.
The RQ is 'What is the mean difference between the kicking distance using dominant and non-dominant legs?'
You don't know what 'standard error' means yet, so don't worry about that column.
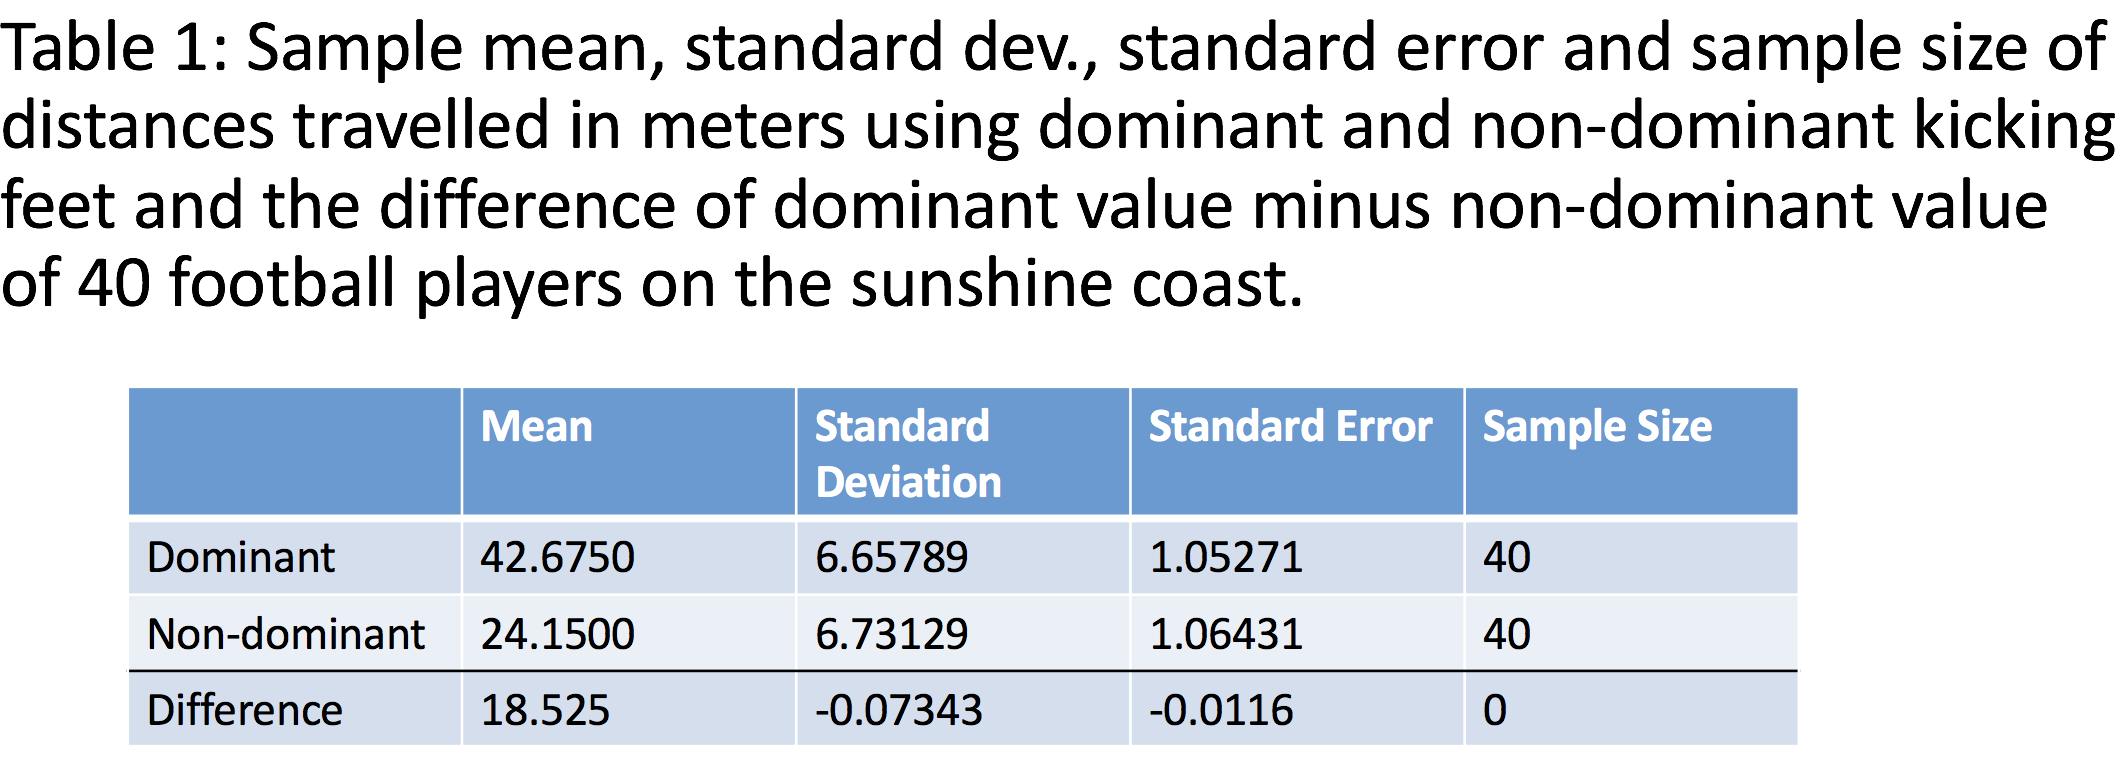
FIGURE 5.3: A numerical summary from a student Project.
Critique the numerical summary in Fig. 5.4, a screenshot from a student Project Report. Identify ways to improve the numerical summary.
The RQ is 'Is there a difference between the proportions of drink orders that are for coffee (rather than non-coffee) comparing the morning and the afternoon?'
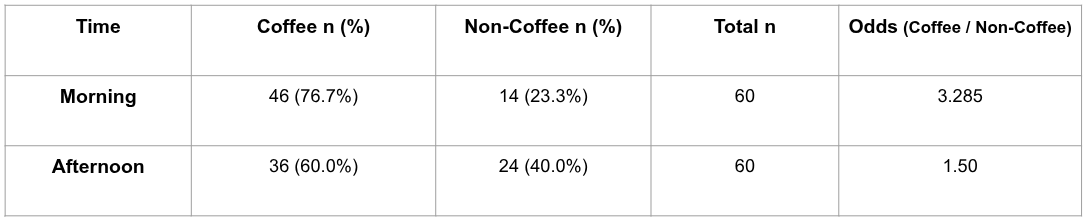
FIGURE 5.4: A numerical summary from a student Project.
Make some notes about important things you learnt from this activity, to remember when creating your numerical summaries for Task 2B.