5.5 Understanding correlations
Answer the following questions, referring to Fig. 5.8. The four correlation coefficients \(r\) are:
| A: \(r = -0.95\) | B: \(r = 0.12\) | C: \(r = 0.75\) | D: \(r = 0.94\) |
- For two plots, a correlation is not suitable. Which two? Explain your answer.
- Determine which plot corresponds to which correlation coefficient (and for which two plots a correlation coefficient is not suitable).
- Think of an example of two quantitative variables that might produce a plot with a direction similar to Plot 1.
- Think of an example of two quantitative variables that might produce a plot with a direction similar to Plot 2.
- Compute the values of \(R^2\) for each plot identified in Part 1 of this question.
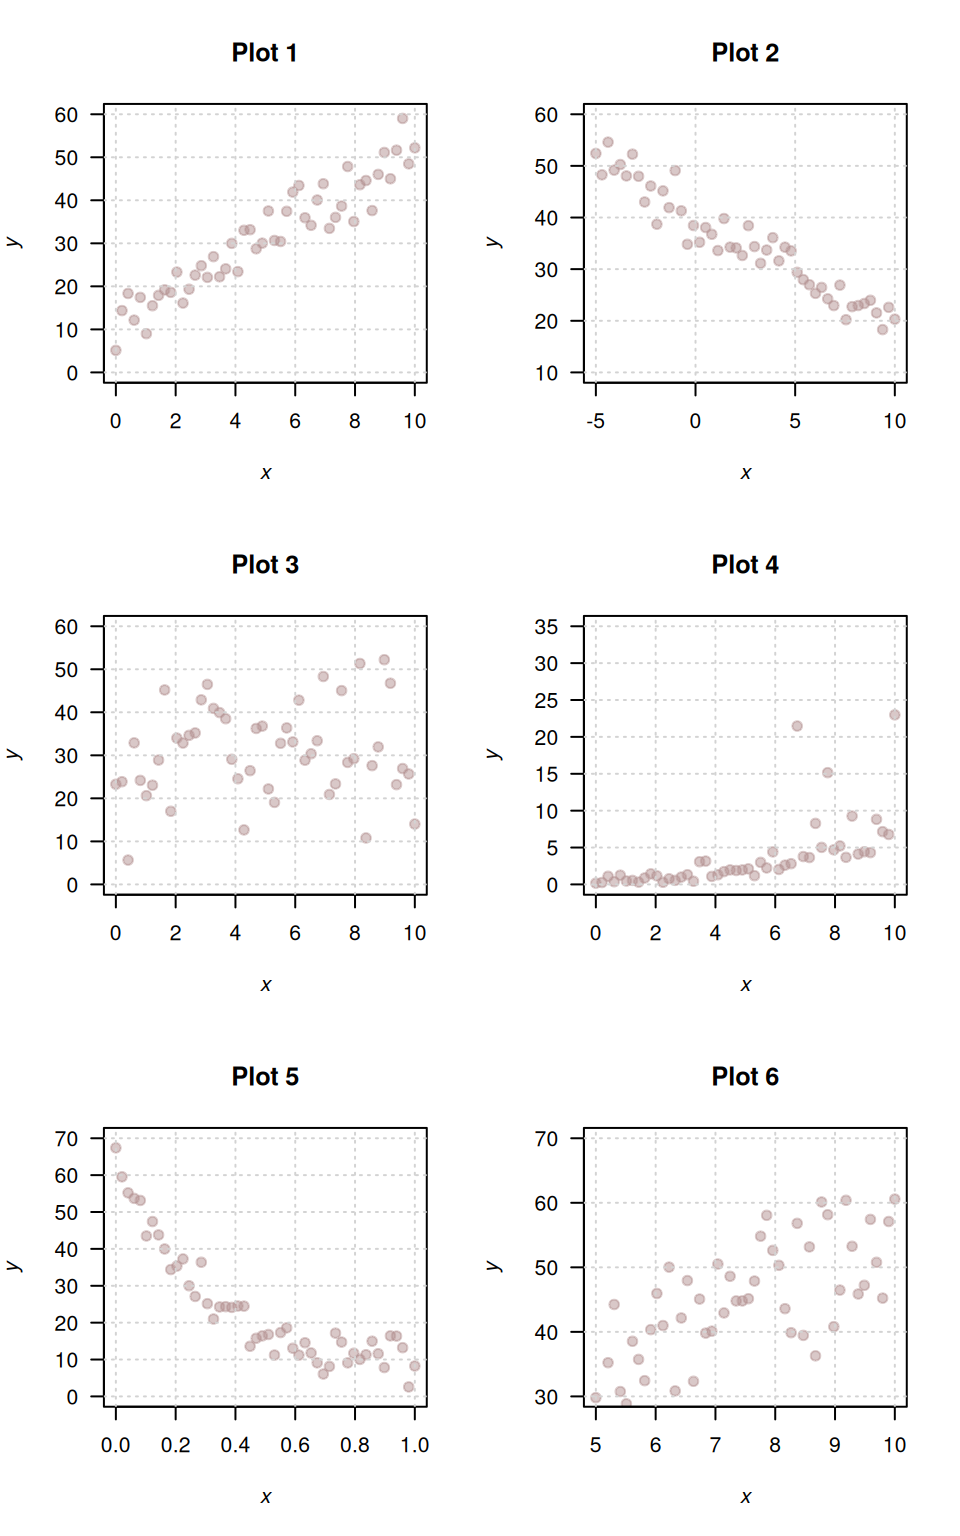
FIGURE 5.8: Six different scatterplots.