9.4 Interpreting jamovi output
The diameter of lime trees (in cms; called DBH (diameter at breast height)), some trees planted and some trees natural, were compared (Schepaschenko et al. 2017). Part of the jamovi output is shown in Fig. 9.1.
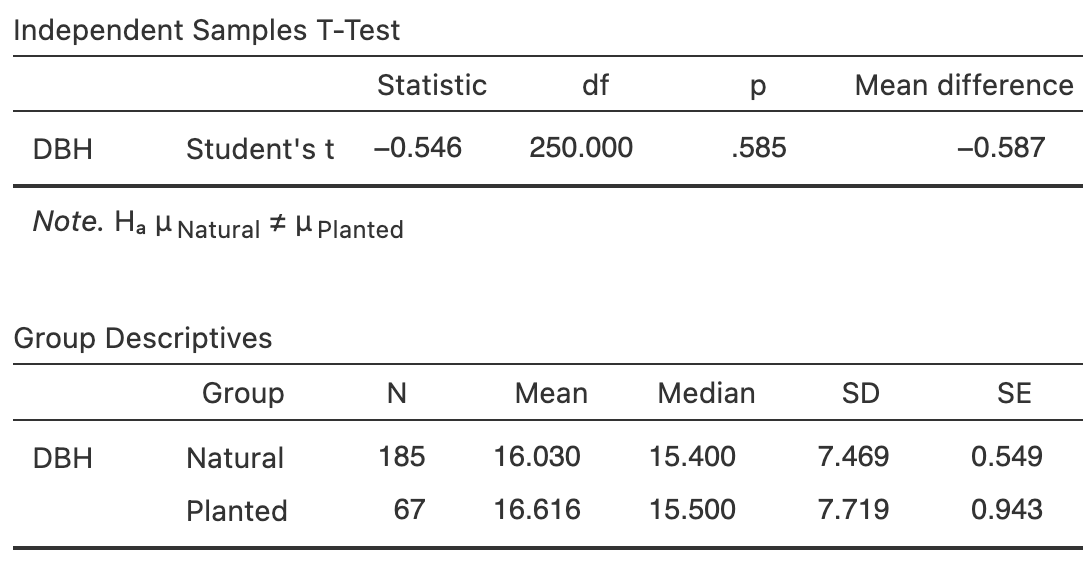
FIGURE 9.1: jamovi output for comparing DBH (in cm) for two groups of lime trees,
- How is the difference between the two groups defined, according to the output?
- What is the parameter according to the output? What does this parameter mean?
- Suppose the \(95\)% CI for the difference was computed as \(-2.7\) to \(1.5\): very carefully interpret what this would mean in context.
- Suppose the \(95\)% CI for the difference was computed as \(0.6\) to \(4.0\): very carefully interpret what this would mean in context.
- Suppose the \(95\)% CI for the difference was computed as \(-4.5\) to \(-1.6\): very carefully interpret what this would mean in context.
References
Schepaschenko D, Shvidenko A, Usoltsev VA, Lakyda P, Luo Y, Vasylyshyn R, et al. Biomass tree data base. Doi:10.1594/PANGAEA.871491, in supplement to: Schepaschenko, d et al. (2017): A dataset of forest biomass structure for eurasia. Scientific data. 2017;4. Available from: https://doi.pangaea.de/10.1594/PANGAEA.871491.