3.3 Define the variable information
For this section, the data introduced in Sect. 1.3 are used, as it demonstrates how to enter data for both quantitative and qualitative variables.
In the Data area, each row represents a unit of analysis (in this case, a person), as is usual in jamovi. For these data, each unit of analysis gets two variables recorded: one is quantitative (Lean angle (in degrees)), and one is qualitative (Age group). So there are two columns in the data, one for each variable (Fig. 3.3).
The order of the variables in the columns doesn’t matter, but here the quantitative variable is listed first (the lean- angle), and then the qualitative variable (the age group).
The variables need to be properly set up by double-clicking on the variable names, as described below.
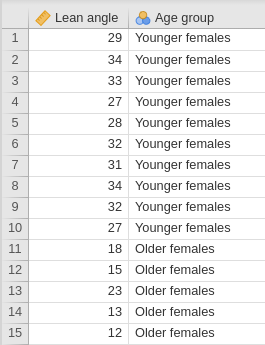

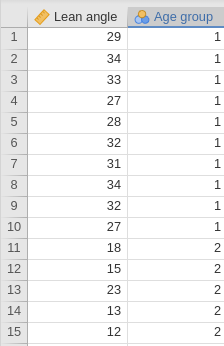
FIGURE 3.3: The data entered in jamovi. Left: Using the actual names of the levels. Right: Using digits to represent the levels.
3.3.1 Adding information for quantitative variables
After double-clicking on the column header (the variable name) for a quantitative variable, set the variable type as Continuous (which, unfortunately, is how jamovi describes all quantitative data).
The Data type can then be set as Integer (discrete) or Decimal (continuous).
Also give the variable a sensible name (Fig. 3.4).
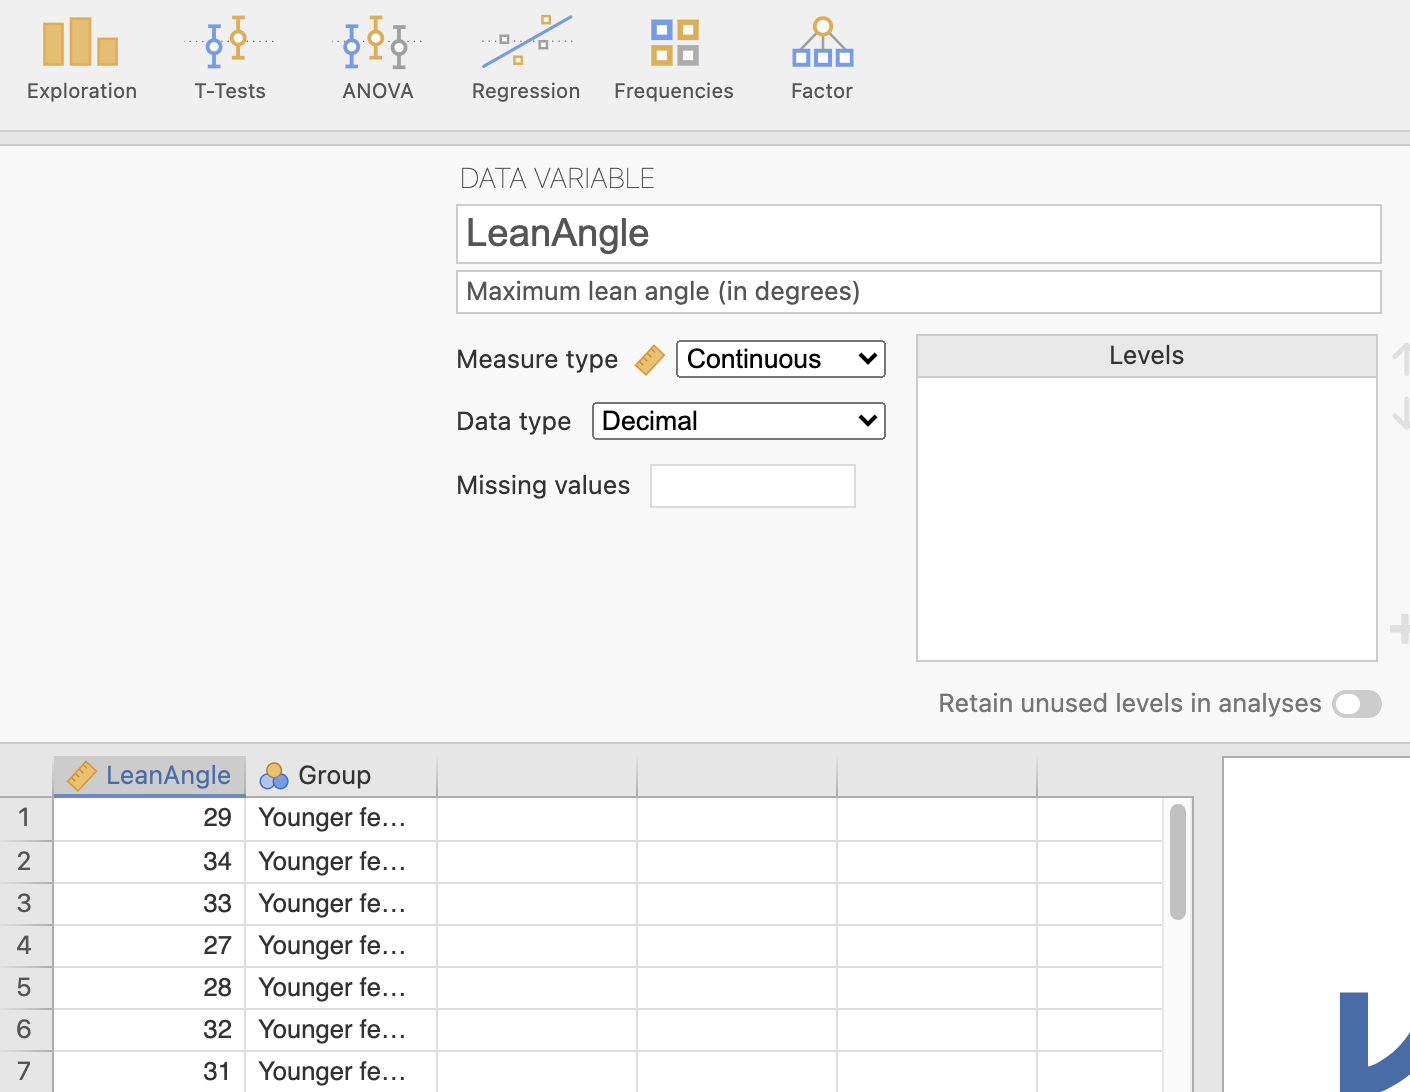
FIGURE 3.4: Describing the quantitative variable.
3.3.2 Adding information for qualitative variables
Qualitative data requires more care than for quantitative variable to set up, as the levels of the variable need to be described. After double-clicking on the column header (the variable name) for a qualitative variable, set the variable type as Nominal or Ordinal as appropriate.
The next step depends on how the data have been, or will be, entered into jamovi.
- If the data have been, or will be, entered by using the actual names of the levels (e.g., one level is labelled
Older femalesand the other asYounger females) as in Fig. 3.3 (left image):- Set the
Data typeasText(Fig. 3.5). - The data is then entered using these exact descriptions for the levels.
- Set the
- If the data have been, or will be, entered by distinguishing the levels using digits (e.g.,
1is used forOlder femalesand2is used forYounger females), as in Fig. 3.3 (right image)- Set the
Data typeasInteger, as in Fig. 3.6. - Then, jamovi must be told what these digits mean, by clicking on the individuals `Levels’ (Fig. 3.7), and replacing digits by what these levels mean. Notice, as shown in Fig. 3.6, that the integers are replaced by their level meanings, even though the digits remain in the data file (i.e., the data have not been changed).
- The data is then entered using these exact digits for the levels.
- Set the
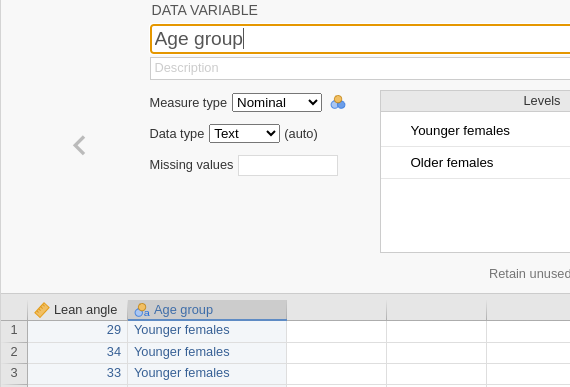
FIGURE 3.5: Describing the qualitative variable. The first level has been described using text descriptions, such as ‘Younger females’.
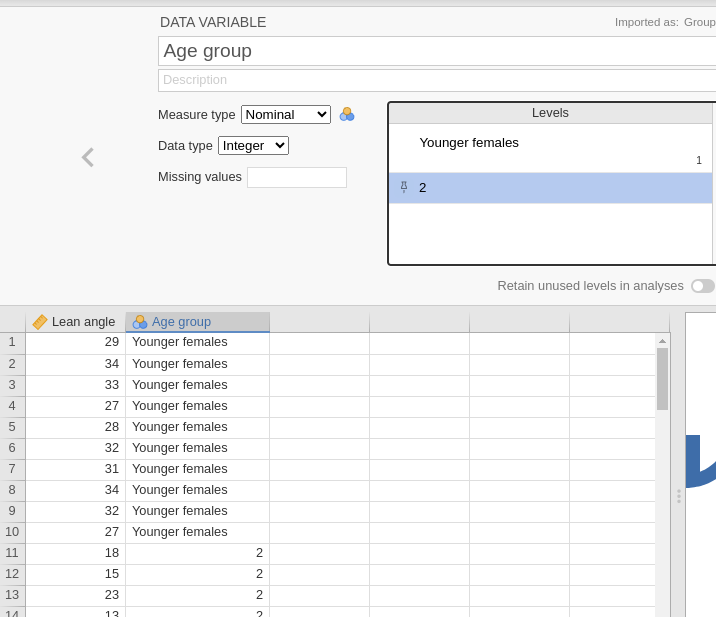
FIGURE 3.6: Describing the qualitative variable: levels are distinguished using digits.
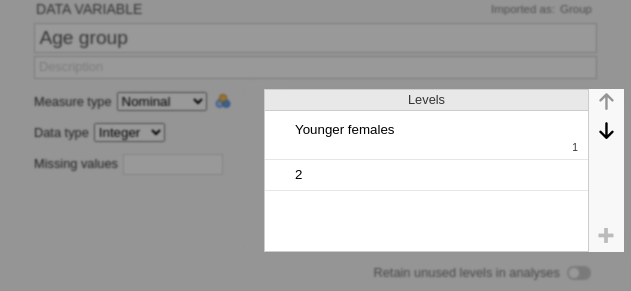
FIGURE 3.7: Describing the qualitative variable.
The two age groups are defined so that a 1 represents younger women, and a 2 represents older women.
In the jamovi worksheet, the values 1 and 2 were entered, but jamovi shows what these mean in the worksheet when these values are defined.