4.3 Boxplots
4.3.1 Creating boxplots
For this section, the data introduced in Sect. 1.3 are used.
- Use the jamovi menu: select Plot and select Box Plot (Fig. 4.3).
- Add the variables. Place the quantitative variable in the Variables area, and the qualitative variable in the Grouping variable 1 area (Fig. 4.4).
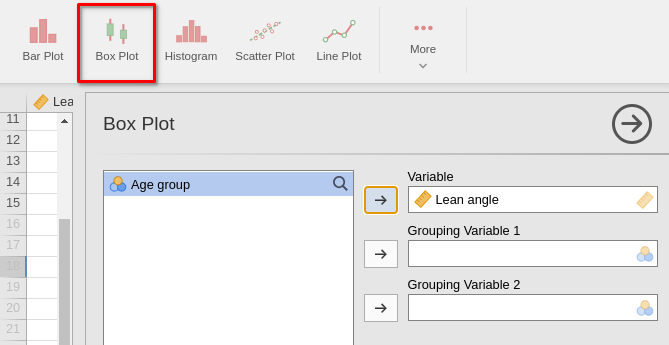
FIGURE 4.3: Selecting a boxplot.
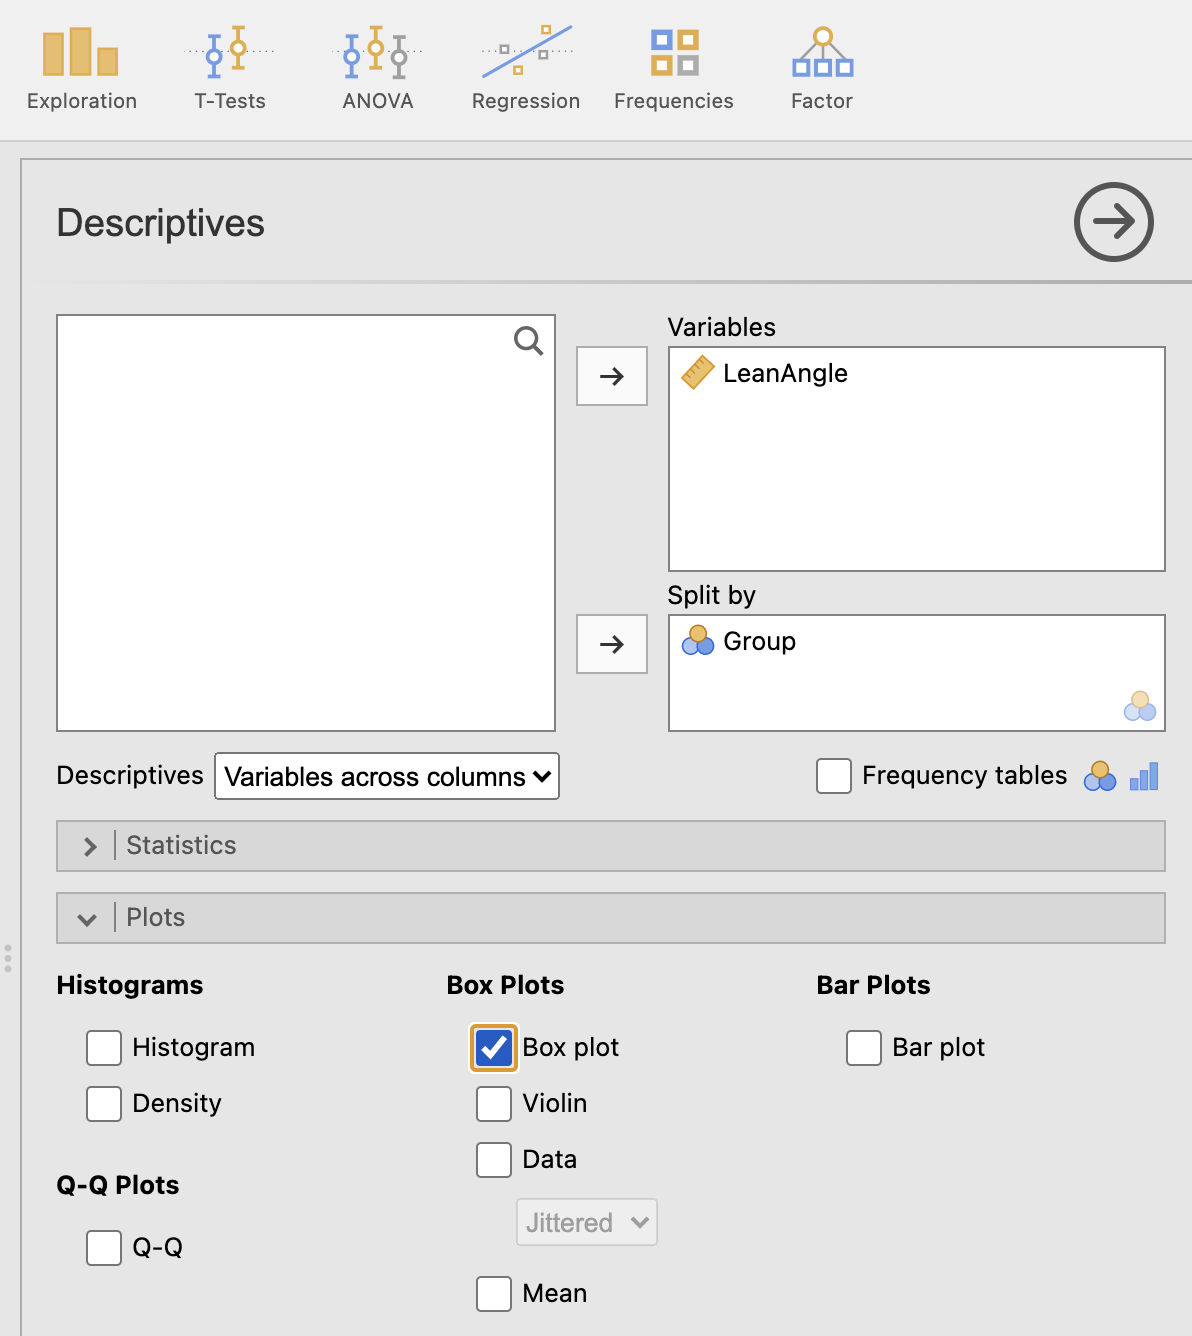
FIGURE 4.4: Selecting the variables for a boxplot.
Your graph will appear in the jamovi Output window.
4.3.2 Editing boxplots
Some boxplot-specific options can be edited by selecting the General Options. You probably will not need to change any of these options.
Making general changes—such as editing axis labels and titles—are discussed in Sect. 4.5.