4.2 Bar charts
4.2.1 Creating bar charts
For this section, the data introduced in Sect. 1.2 are used.
- Use the jamvoi menu: select Plot and select Bar Plot (Fig. 4.1).
- Add the variables.
Add the variables to the rows and columns (in this case, the
Categorical VariableisDiet, and theGrouping VariableisB12), as in Fig. 4.1.
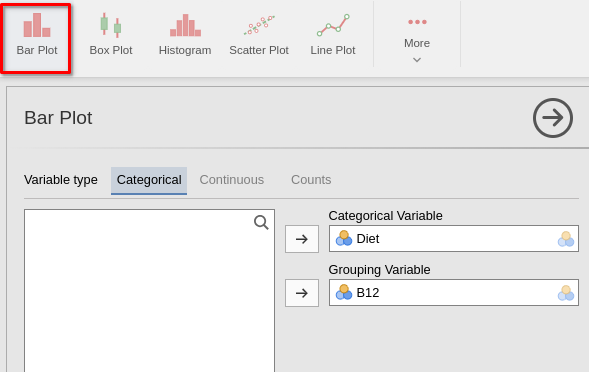
FIGURE 4.1: Adding the variables to create a bar chart in jamovi.
Your graph will appear in the jamovi Output window.
- To change the type of bar chart (i.e., stacked barchart or side-by-side barchart), select the
Group Optionsand then the type of bar chart you would like, as in Fig. 4.2:
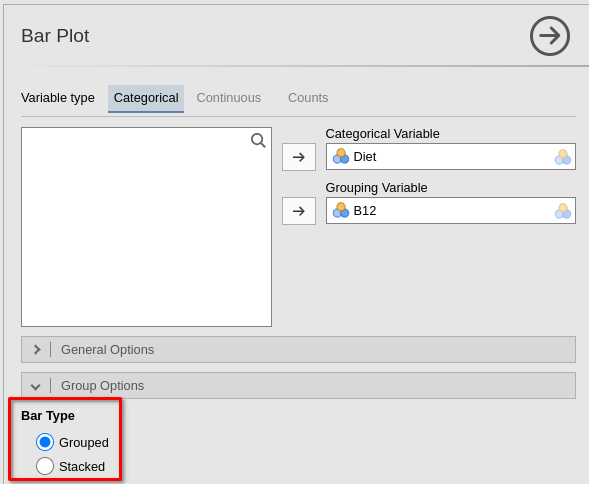
FIGURE 4.2: Selecting the type of bar chart.
Making general changes—such as editing axis labels and titles—are discussed in Sect. 4.5.