4.5 Editing plots
The options to edit bar charts and boxplots are at the bottom of the plot window (Fig. 4.5).
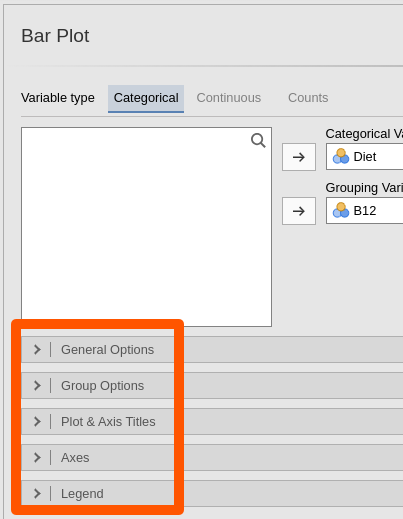

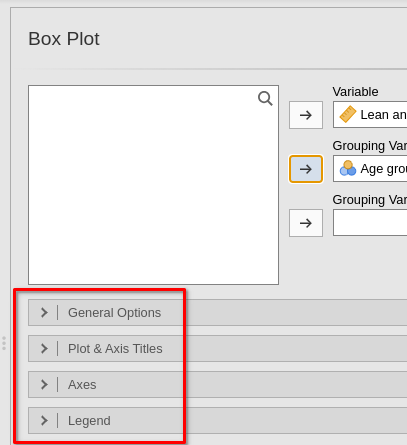
FIGURE 4.5: The plotting options for bar charts (left) and boxplots (right).
Clicking on the options reveals the things that can be changed (Fig. 4.6):
- Plot and Axis Titles:
- The Plot Title: The plot title must be meaningful and contextual
- The Plot Subtitle: The plot subtitle may not be necessary. If you do add a subtitle, it must be meaningful and contextual
- The Plot Caption: The caption can be added here, or can be added in Word or PowerPoint etc. after pasting the plot into your document.
- The X-Axis Title:
The label on the horizontal (
X) axis must be meaningful and contextual. - The Y-Axis Title:
The label on the vertical (
Y) axis must be meaningful and contextual (and including units of measurement when appropriate).
- Axes:
You may also need to adjust the upper and lower limits of the
Yaxis (called the Range) - Legend: The plot legend can be adjusted here if necessary. Importantly, the legend title must be meaningful and contextual.
Your changes will be evident in plot in the jamovi Output window.
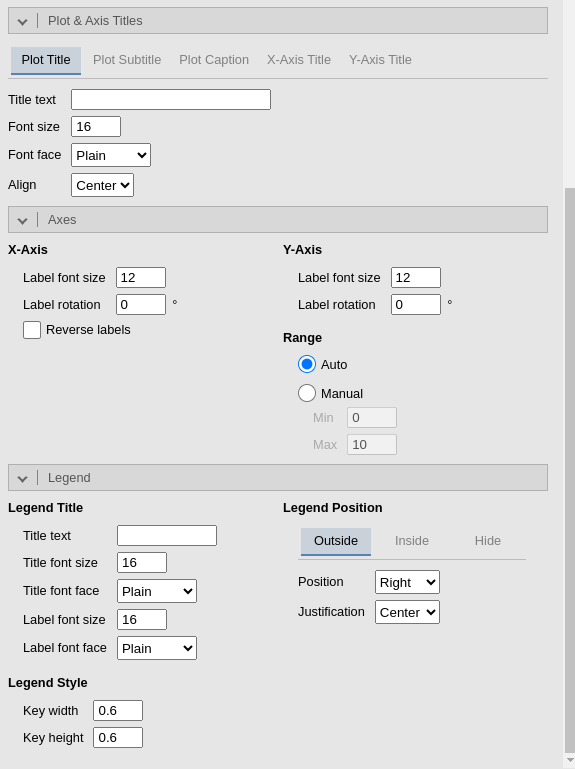
FIGURE 4.6: The plotting options expanded for bar charts